

Question: Perform the following using Microsoft Excel: B D E F G H 1 1 K Customer Classification and Selection: RFM Analysis Suppose you have the
Perform the following using Microsoft Excel:
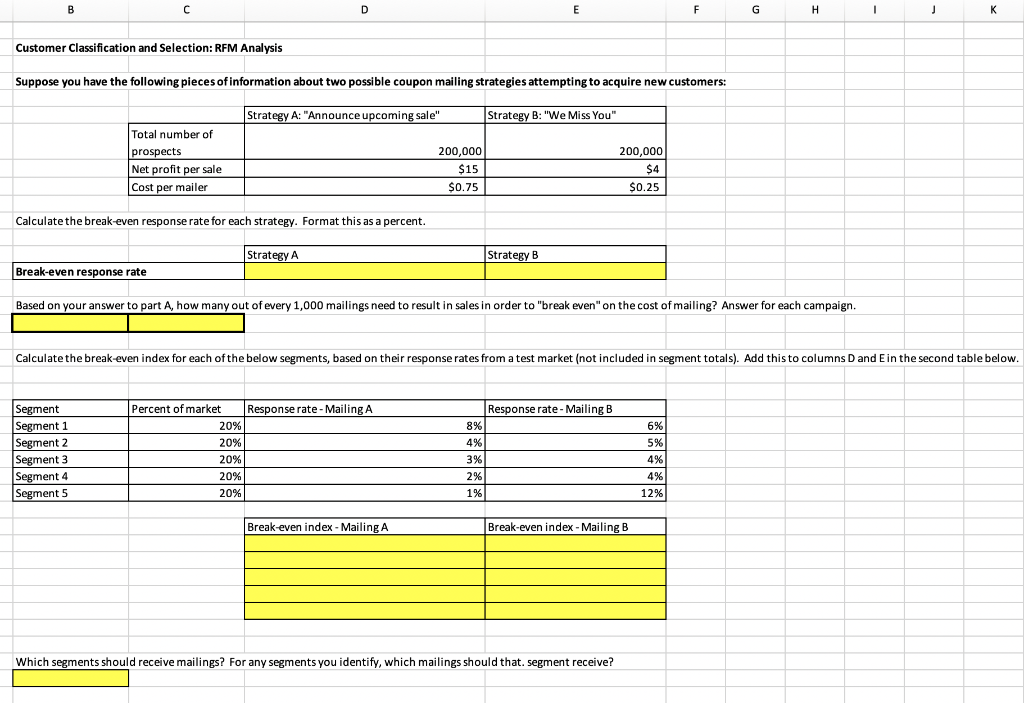
B D E F G H 1 1 K Customer Classification and Selection: RFM Analysis Suppose you have the following pieces of information about two possible coupon mailing strategies attempting to acquire new customers: Strategy A: "Announce upcoming sale" Strategy B: "We Miss You" Total number of prospects Net profit per sale Cost per mailer 200,000 $15 $0.75 200,000 $4 $0.25 Calculate the break-even response rate for each strategy. Format this as a percent. Strategy A Strategy B Break-even response rate Based on your answer to part A, how many out of every 1,000 mailings need to result in sales in order to "break even" on the cost of mailing? Answer for each campaign. Calculate the break-even index for each of the below segments, based on their response rates from a test market (not included in segment totals). Add this to columns Dand Ein the second table below. Response rate - Mailing B Segment Segment 1 Segment 2 Segment 3 Segment 4 Segment 5 Percent of market Response rate - Mailing A 20% 20% 20% 20% 20% 8% 4% 3% 2% 1% 6% 5% 4% 4% 12% Break-even index - Mailing A Break-even index - Mailing B Which segments should receive mailings? For any segments you identify, which mailings should that. segment receive? B D E F G H 1 1 K Customer Classification and Selection: RFM Analysis Suppose you have the following pieces of information about two possible coupon mailing strategies attempting to acquire new customers: Strategy A: "Announce upcoming sale" Strategy B: "We Miss You" Total number of prospects Net profit per sale Cost per mailer 200,000 $15 $0.75 200,000 $4 $0.25 Calculate the break-even response rate for each strategy. Format this as a percent. Strategy A Strategy B Break-even response rate Based on your answer to part A, how many out of every 1,000 mailings need to result in sales in order to "break even" on the cost of mailing? Answer for each campaign. Calculate the break-even index for each of the below segments, based on their response rates from a test market (not included in segment totals). Add this to columns Dand Ein the second table below. Response rate - Mailing B Segment Segment 1 Segment 2 Segment 3 Segment 4 Segment 5 Percent of market Response rate - Mailing A 20% 20% 20% 20% 20% 8% 4% 3% 2% 1% 6% 5% 4% 4% 12% Break-even index - Mailing A Break-even index - Mailing B Which segments should receive mailings? For any segments you identify, which mailings should that. segment receive
Step by Step Solution
There are 3 Steps involved in it

Get step-by-step solutions from verified subject matter experts