Question: Perform the indicated operations by hand. Then use a calculator to check your work. 7 Co 10 2 . . . 7 U N N
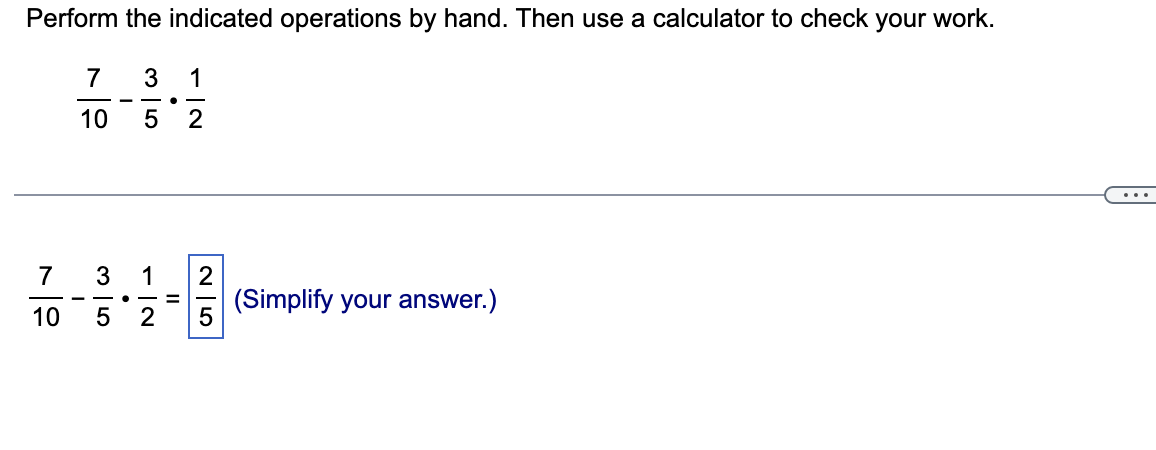
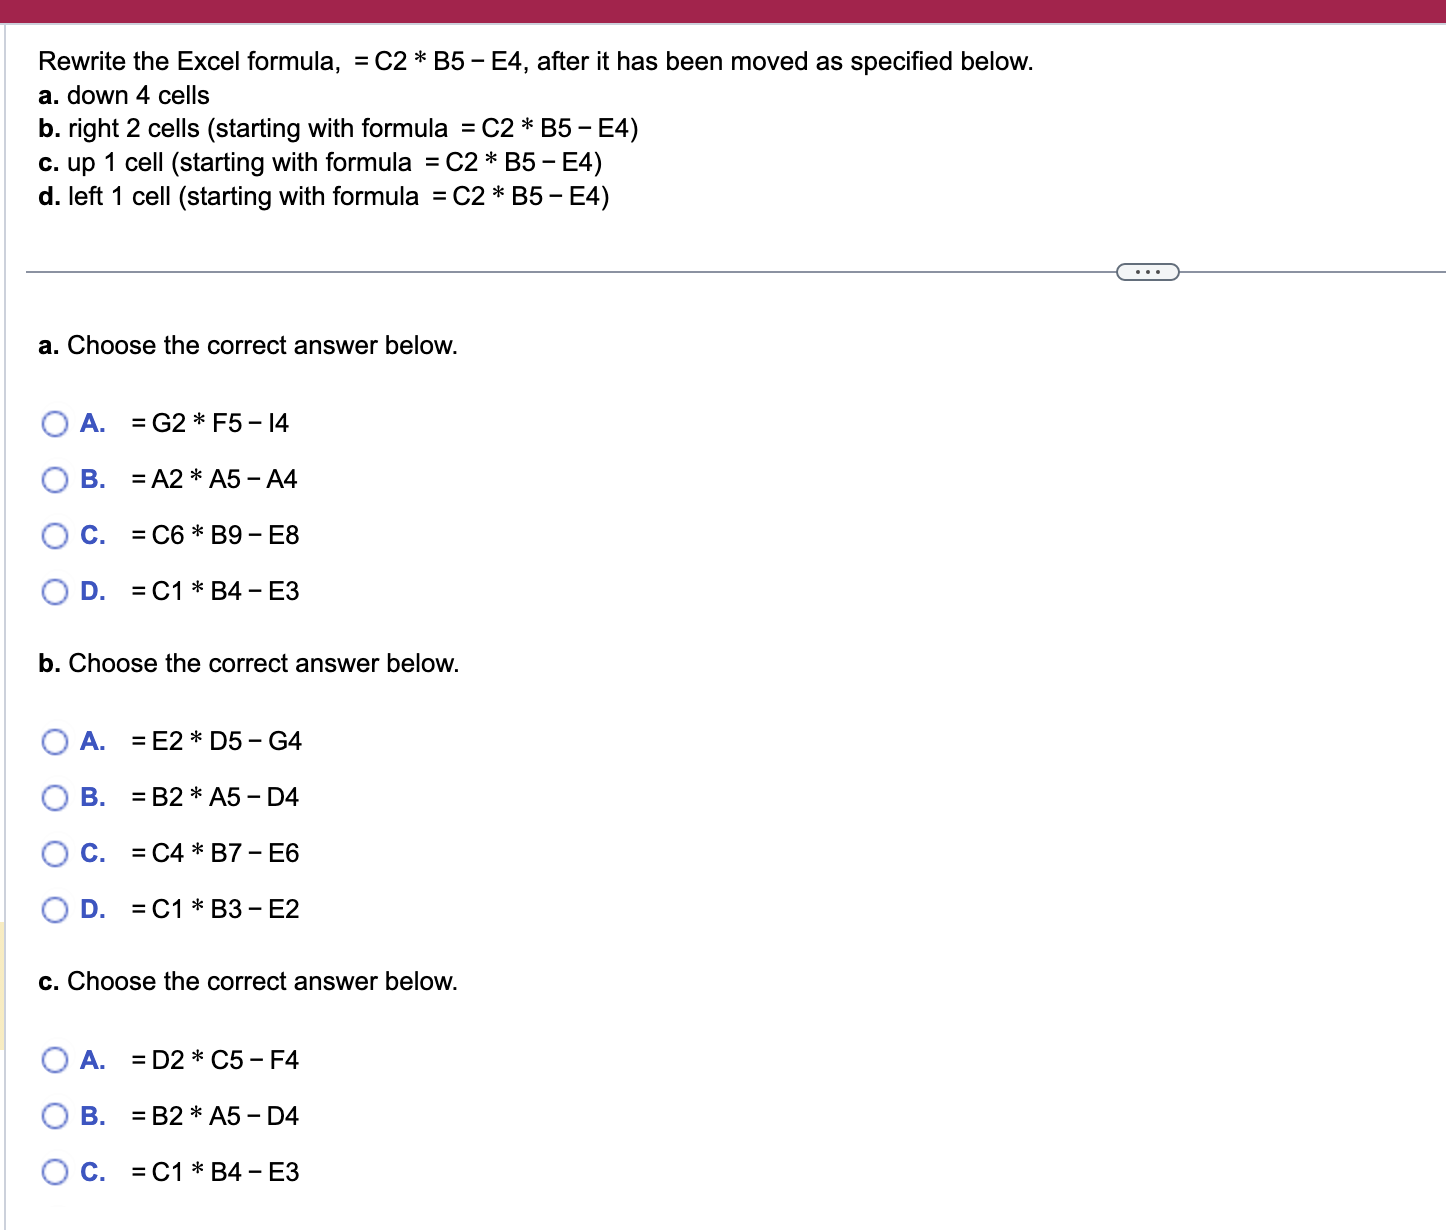
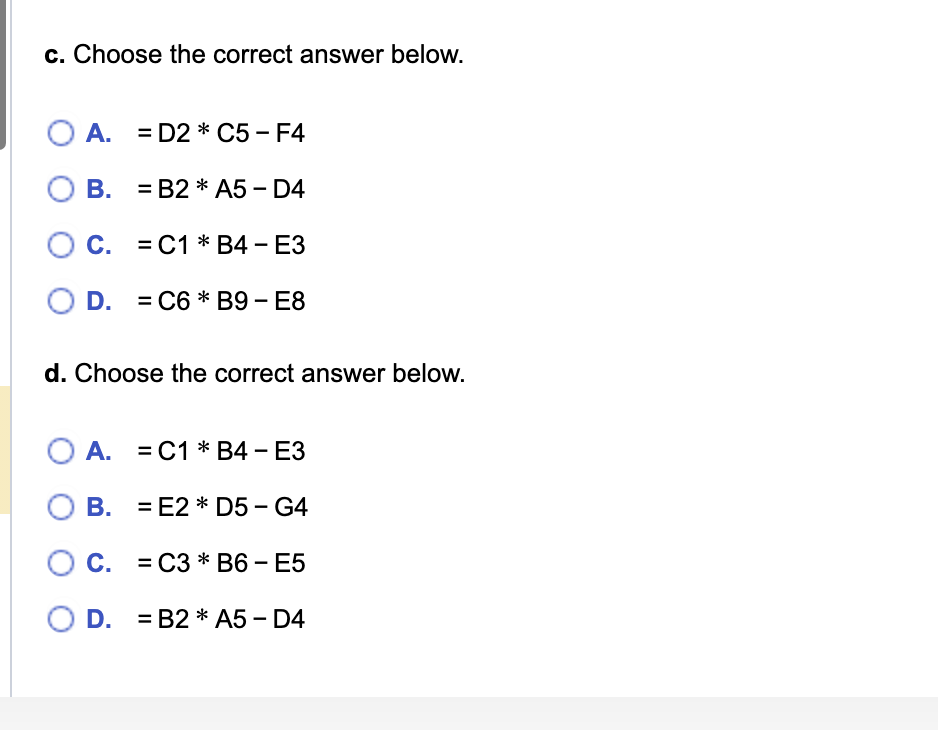
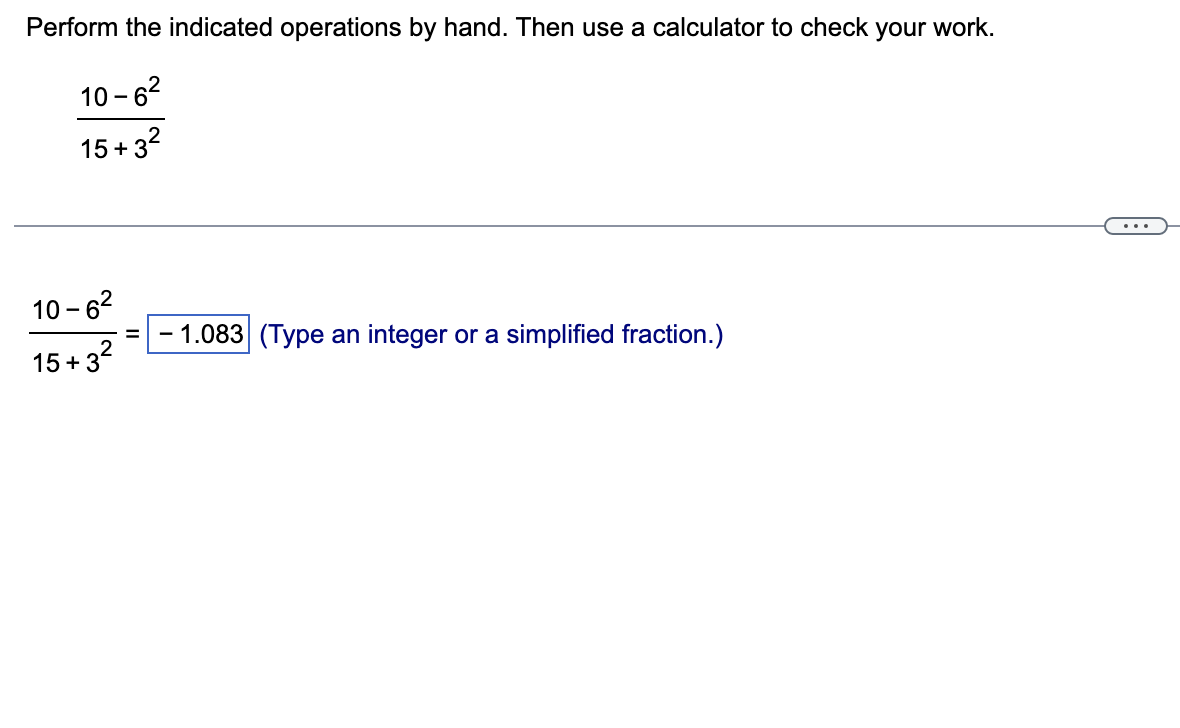
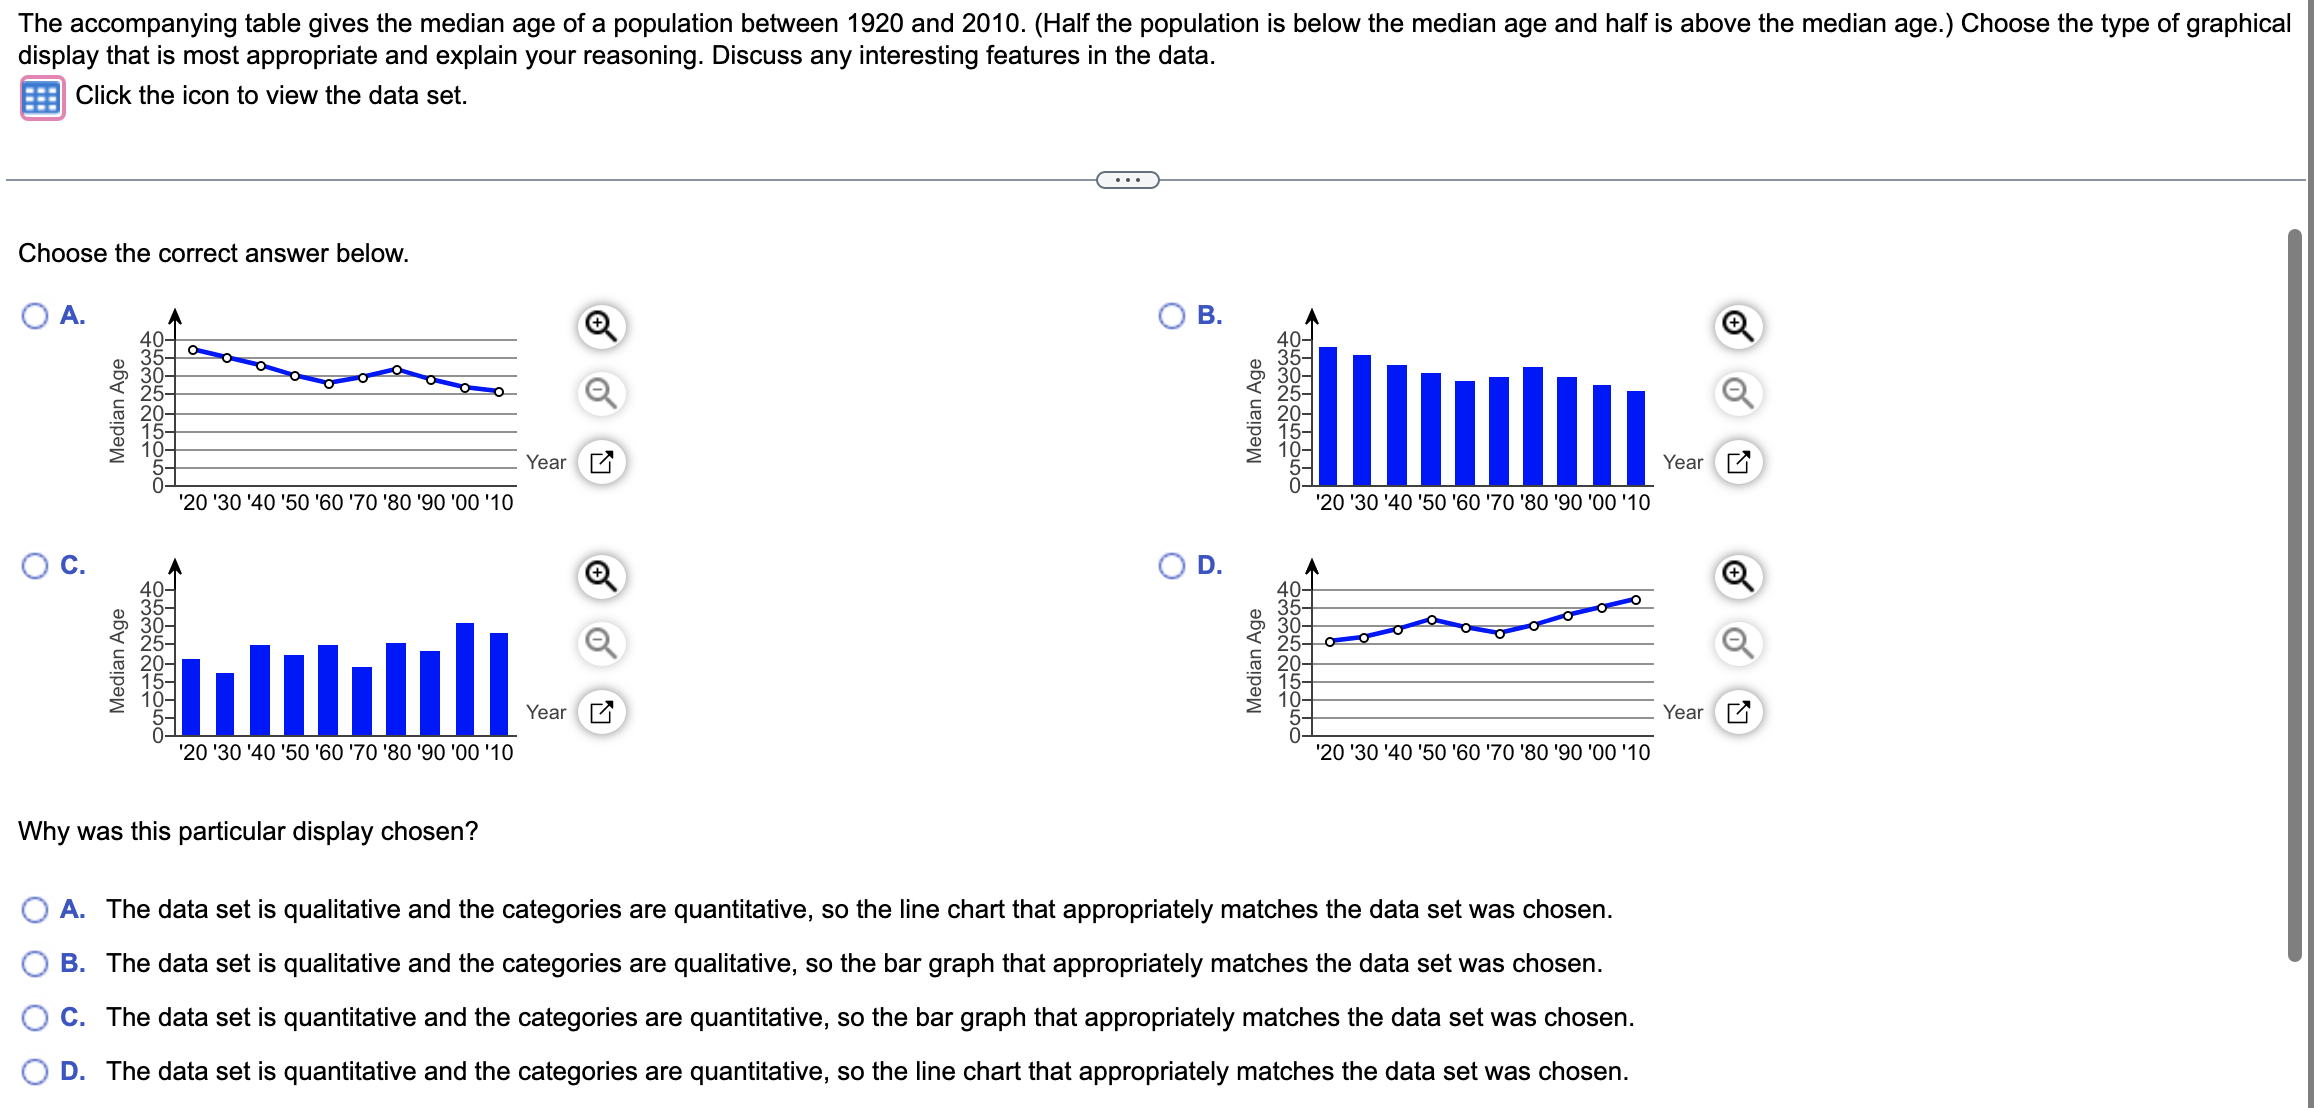
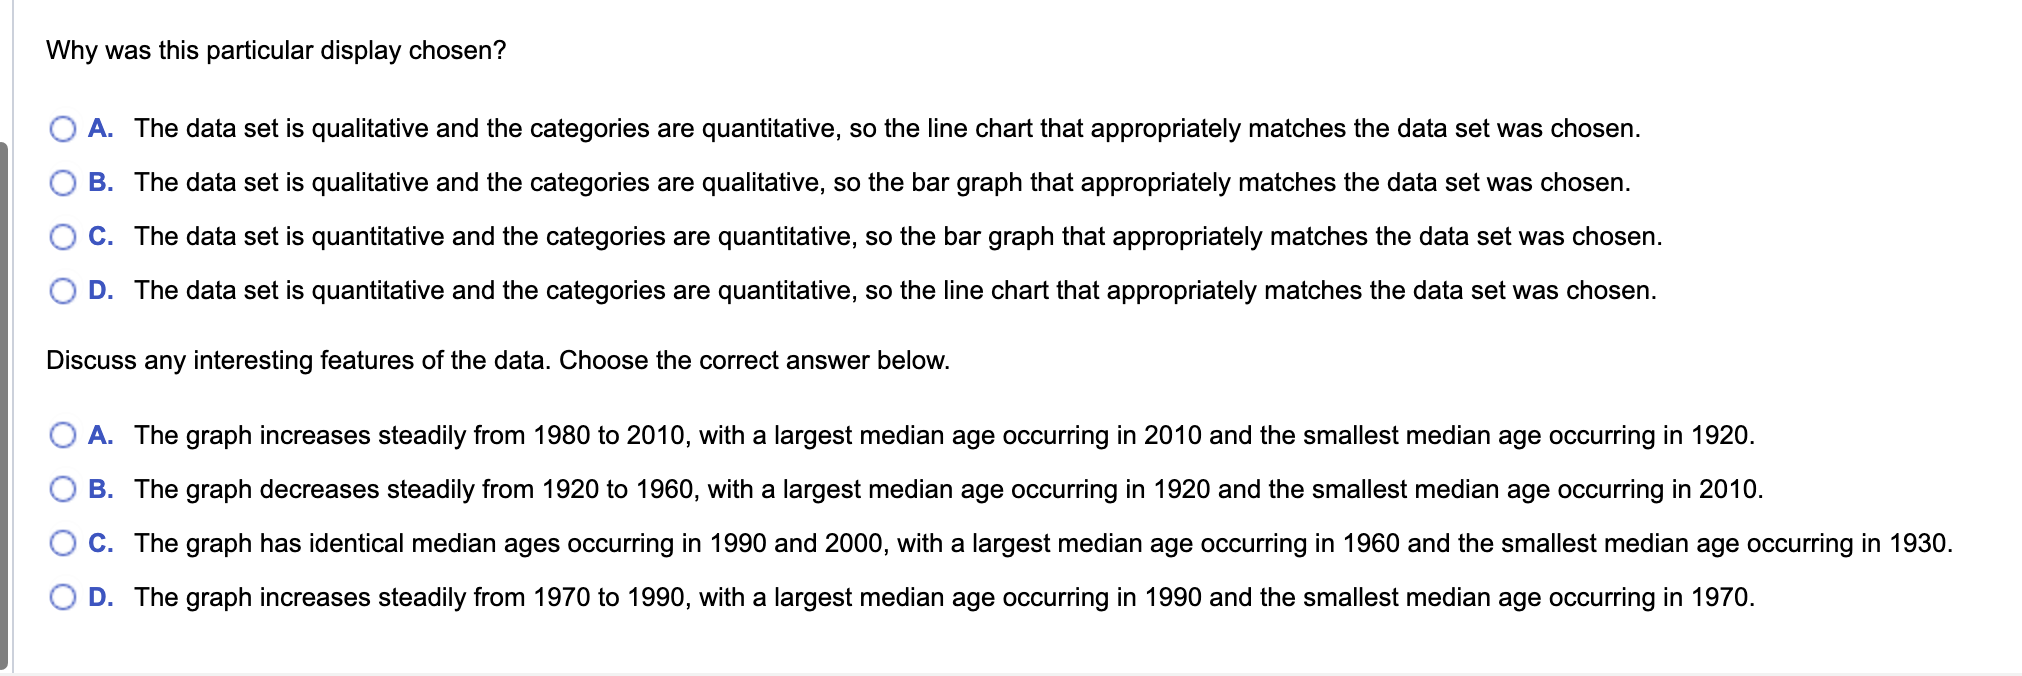
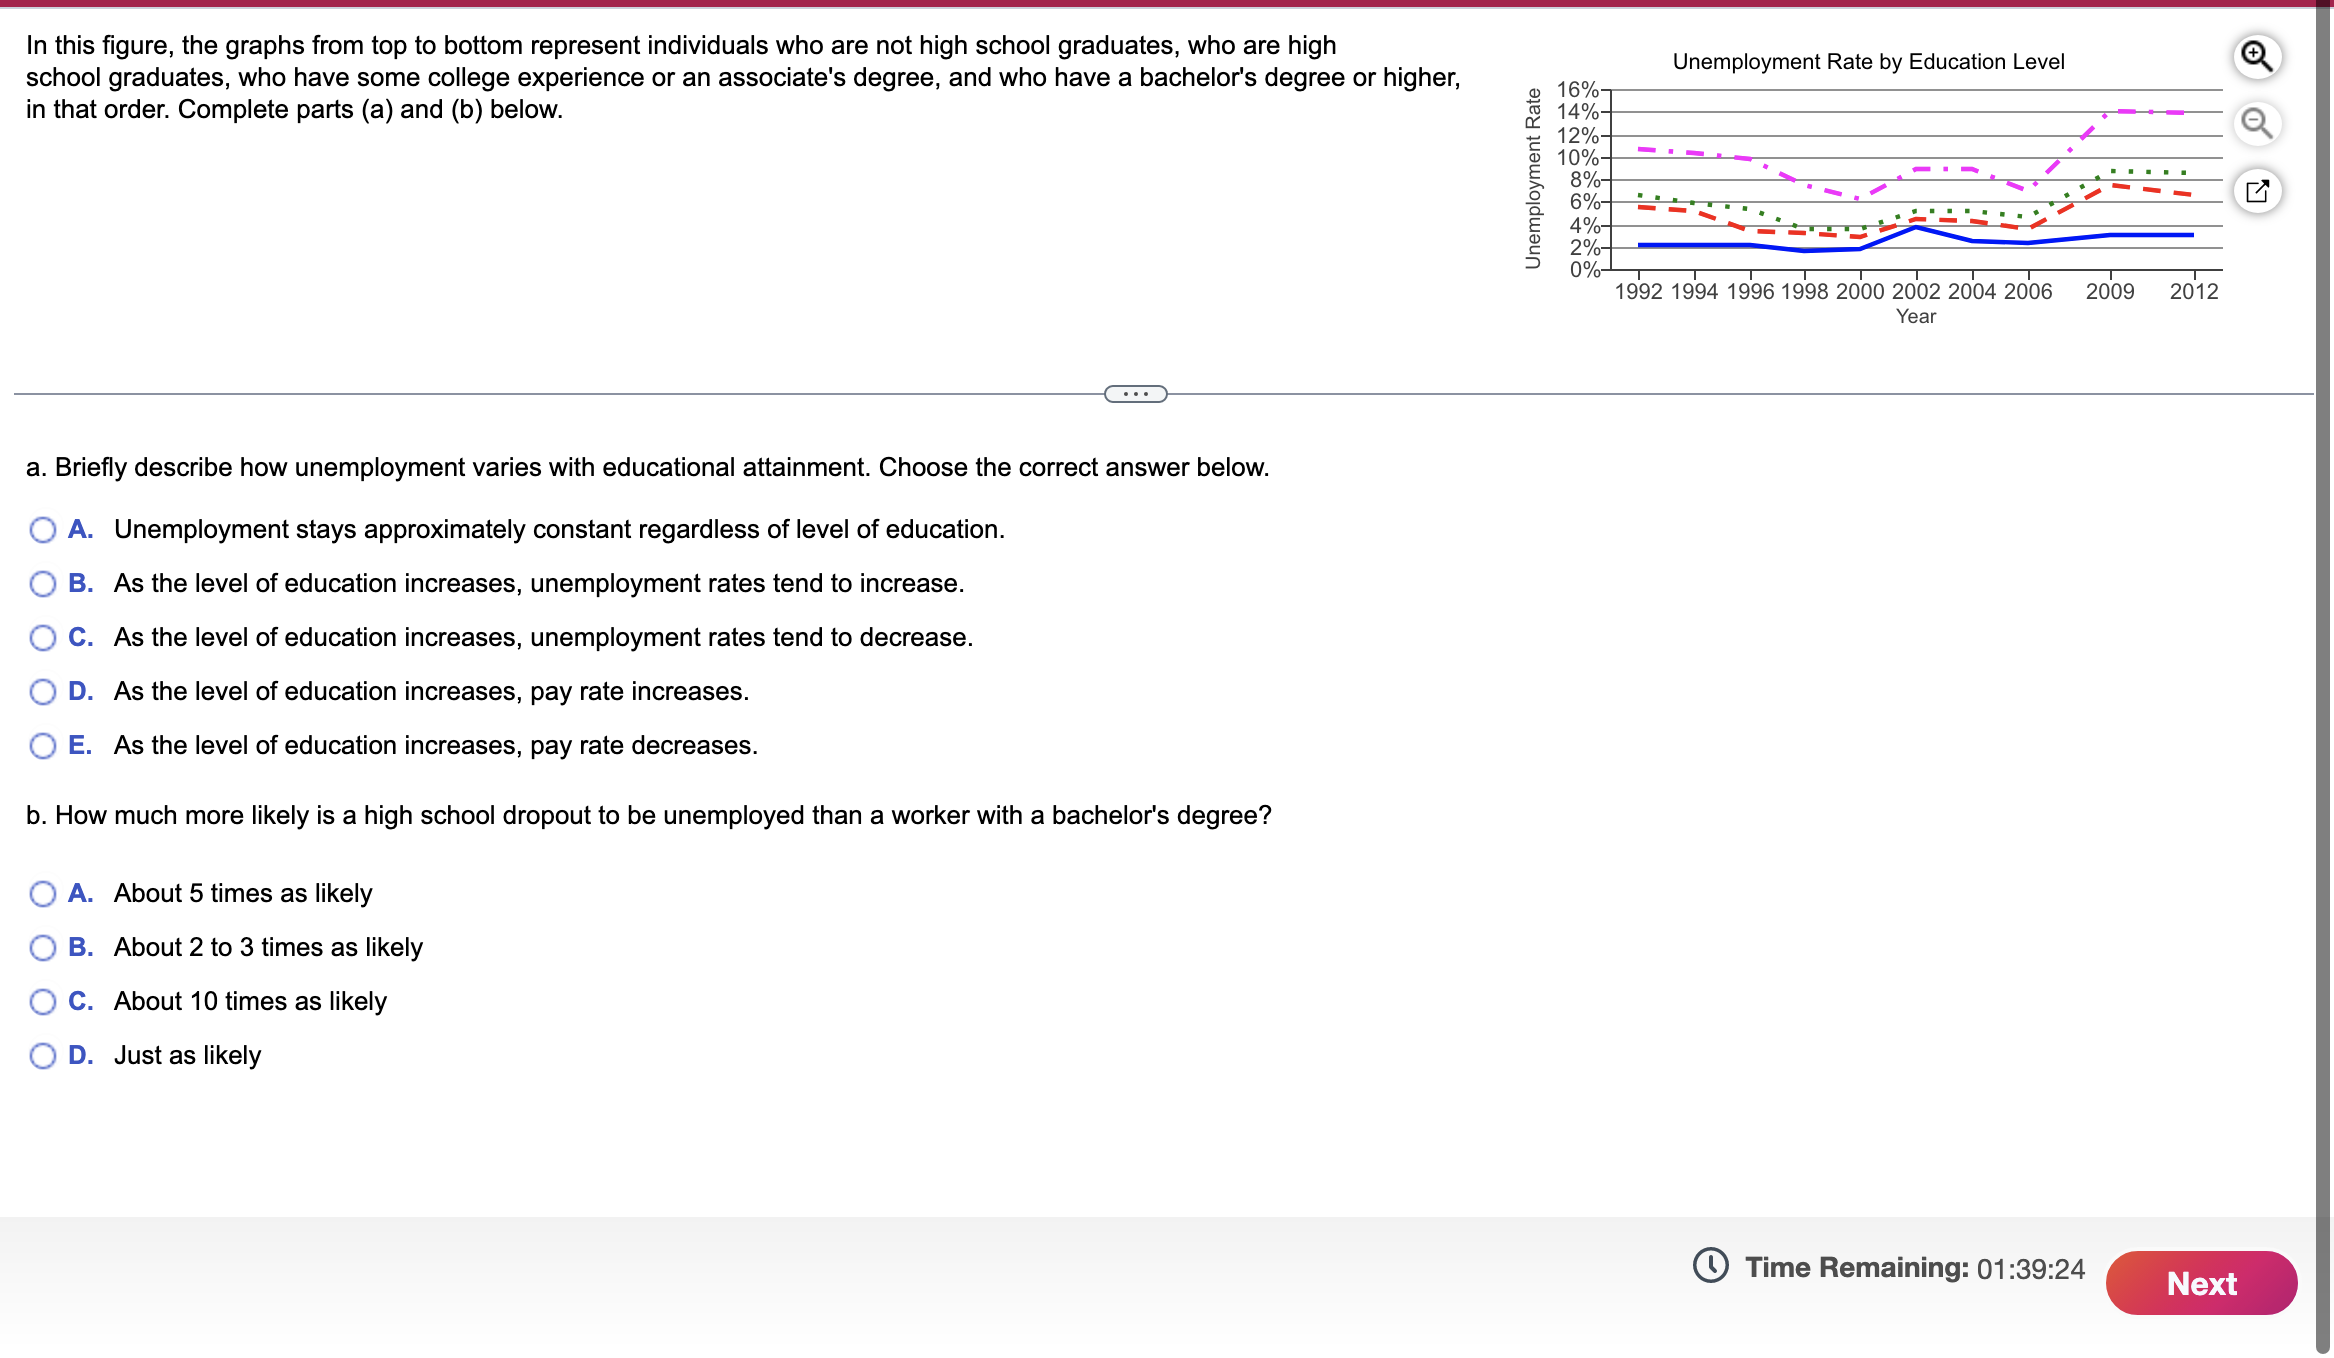
Perform the indicated operations by hand. Then use a calculator to check your work. 7 Co 10 2 . . . 7 U N N - 10 (Simplify your answer.)Rewrite the Excel formula, = C2 * B5 - E4, after it has been moved as specified below. a. down 4 cells b. right 2 cells (starting with formula = C2 * B5 - E4) c. up 1 cell (starting with formula = C2 * B5 - E4) d. left 1 cell (starting with formula = C2 * B5 - E4) (. . . a. Choose the correct answer below. O A. = G2 * F5 - 14 O B. = A2 * A5 - A4 O C. = C6 * B9 - E8 O D. = C1 * B4 - E3 b. Choose the correct answer below. O A. = E2 * D5 - G4 O B. = B2 * A5 - D4 O C. = C4 * B7 - E6 O D. = C1 * B3 - E2 c. Choose the correct answer below. O A. = D2 * C5 - F4 O B. = B2 * A5 - D4 O C. = C1 * B4 - E3c. Choose the correct answer below. {12- A. = D2 * C5 - F4 {32- B. = I32 * A5 D4 {:1- c. = C1 * B4 - E3 {32- D. = 06 * I39 E8 (I. Choose the correct answer below. {:3 A. = C1 * B4 E3 {:2- B. = E2 * D5 - G4 cf} c. = C3 * I36 E5 {32- D. = I32 * A5 D4 Perform the indicated operations by hand. Then use a calculator to check your work. 10-62 15+32 1062 15+32 = - 1.083 (Type an integer or a simplified fraction.) The accompanying table gives the median age ofa population between 1920 and 2010. (Half the population is below the median age and half is above the median age.) Choose the type of graphical display that is most appropriate and explain your reasoning. Discuss any interesting features in the data. Click the icon to view the data set. Choose the correct answer below. {:2- A. 405 (9' {:2- B. 405 (9' Q Q Median Age N O I Median Age N O I 5_ Year ['7' 5- Year ['7' '20 '30 '40 '50 I60 '70 I80 '90 '00 '10 '20 '30 '40 '50 I60 '70 I80 '90 '00 '10 Median Age N O I Median Age 5- Year ['7' 0 '20 '30 '40 '50 I60 '70 I80 '90 '00 '10 '20 '30 '40 '50 '60 '70 '80 '90 '00 '10 Year ['7' Why was this particular display chosen? . The data set is qualitative and the categories are quantitative, so the line chart that appropriately matches the data set was chosen. . The data set is qualitative and the categories are qualitative, so the bar graph that appropriately matches the data set was chosen. . The data set is quantitative and the categories are quantitative, so the bar graph that appropriately matches the data set was chosen. . The data set is quantitative and the categories are quantitative, so the line chart that appropriately matches the data set was chosen. Why was this particular display chosen? The data set is qualitative and the categories are quantitative, so the line chart that appropriately matches the data set was chosen. The data set is qualitative and the categories are qualitative, so the bar graph that appropriately matches the data set was chosen. The data set is quantitative and the categories are quantitative, so the bar graph that appropriately matches the data set was chosen. 9.097? The data set is quantitative and the categories are quantitative, so the line chart that appropriately matches the data set was chosen. Discuss any interesting features of the data. Choose the correct answer below. The graph increases steadily from 1980 to 2010, with a largest median age occurring in 2010 and the smallest median age occurring in 1920. The graph decreases steadily from 1920 to 1960, with a largest median age occurring in 1920 and the smallest median age occurring in 2010. The graph has identical median ages occurring in 1990 and 2000, with a largest median age occurring in 1960 and the smallest median age occurring in 1930. 9.097? The graph increases steadily from 1970 to 1990, with a largest median age occurring in 1990 and the smallest median age occurring in 1970. In this gure, the graphs from top to bottom represent individuals who are not high school graduates, who are high school graduates, who have some college experience or an associate's degree, and who have a bachelor's degree or higher, in that order. Complete parts (a) and (b) below. Unemployment Rate by Education Level 16% 14% 12% 10% 8% 6% 4% 2% 0% Unemployment Rate I I I I I I I I I 1992 1994 19961998 2000 2002 2004 2006 2009 2012 Year a. Briey describe how unemployment varies with educational attainment. Choose the correct answer below. ( I A. Unemployment stays approximately constant regardless of level of education. I' I B. As the level of education increases, unemployment rates tend to increase. ( I 0. As the level of education increases, unemployment rates tend to decrease. I' I D. As the level of education increases, pay rate increases. ( I E. As the level of education increases, pay rate decreases. b. How much more likely is a high school dropout to be unemployed than a worker with a bachelor's degree? CI A. About 5 times as likely ( I B. About2to 3times as likely i I C. About 10times as likely ( ID. Just as likely C) Time Remaining: 01:39:24 m In the following situation, state whether two variables are related in a way that might be described by a function. If so, identify the independent and dependent variables. You run different distance intervals on a track and want to know how your heart rate depends on the distances you run at a fixed speed. E) Determine whether the two variables are related in a way that might be described by a function. If the situation could be described as a function, then identify the independent and dependent variables. Choose the correct answer below. {f} A. The situation can be described by a function. There is a dependent variable, but no independent variable. The dependent variable is your heart rate. B. The situation can be described by a function. The dependent variable is the distance run and the independent variable is your heart rate. a} C. The situation cannot be described by a function. {I} D. The situation can be described by a function. The dependent variable is your heart rate and the independent variable is the distance run
Step by Step Solution
There are 3 Steps involved in it
1 Expert Approved Answer
Step: 1 Unlock
Question Has Been Solved by an Expert!
Get step-by-step solutions from verified subject matter experts
Step: 2 Unlock
Step: 3 Unlock
Students Have Also Explored These Related Mathematics Questions!