

Question: Performance Drivers / Assumptions -7 -1 Base Year +3 +4 1+5 * Growth in revenues 6 256 55.896 57%% 7 89% 10.13 12% RED %%
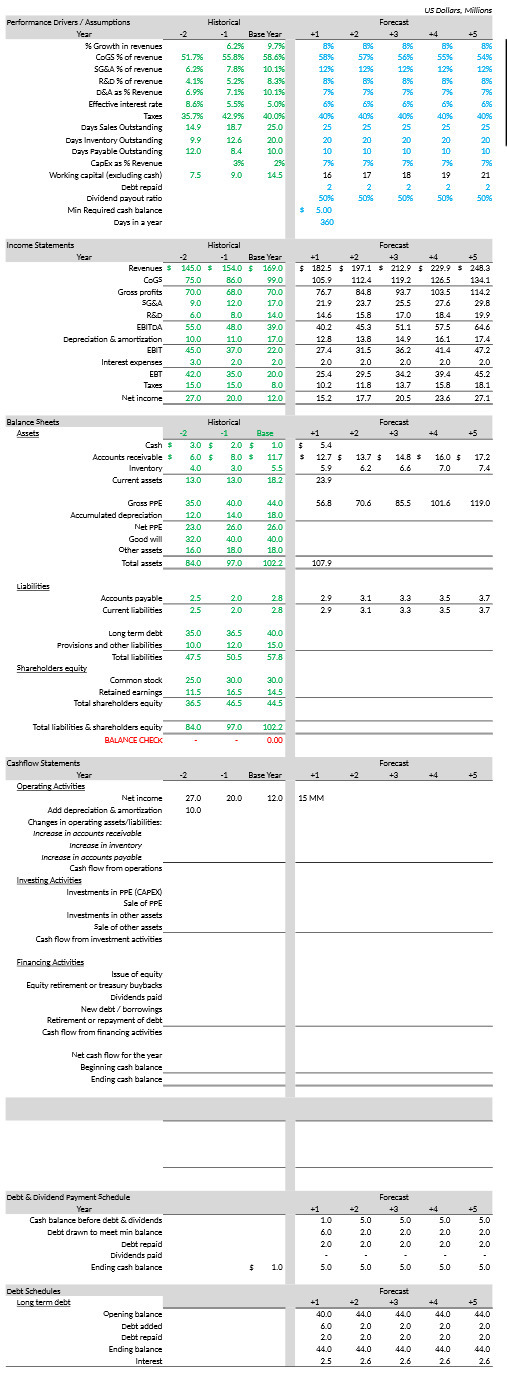

Performance Drivers / Assumptions -7 -1 Base Year +3 +4 1+5 * Growth in revenues 6 256 55.896 57%% 7 89% 10.13 12% RED %% of revenue 5.26 836 7.196 7%% Effective interest rate 8.696 5.5% 5.0%% 6%% Taxes 25.796 42.956 40.096 Days Sales Outstanding 14.9 18.7 Days Inventory Outstanding 9.9 12.6 20.0 Days Fayable Outstanding 12.0 10.0 Working capital (excluding cash) 16 Dividend payout ratio 50%% Min Required cash balance Day's in a year 250 Income Statements Historical +3 169. 1825 $ 197.1 212.9 $ 229.9 75.0 86.0 99.0 105.9 119.2 126.5 134. 70.0 68.0 70.0 76.7 34.8 93.7 103.5 114. SG&A 12.0 17.0 21.9 23.7 25.5 27.6 6.0 8.0 14.0 17.0 18.4 19.9 EPITOA 55.0 48.0 39 0 40.2 45.3 51.1 57.5 64.6 10.0 11.0 17.0 12.8 12.8 14.9 16.1 17.4 45.0 36.2 Interest expenses 2.0 20 2.0 2.0 20 EBT 42.0 35.0 20.0 25.4 29.5 34.2 39.4 45.2 Taxes 15.0 15.0 10.2 11.8 13.7 15.8 18.1 Net income 27.0 20.0 120 15.2 17.7 20.5 23.6 27.1 Balance Sheets Assets 5.4 5.0 5 13.7 $ 14.6 $ 16.0 $ 17.2 2.0 7.0 Current assets 13.0 12.0 182 23.9 Gross PPE 25.0 40.0 44.0 56.8 70.6 65.5 119.0 Accumulated depreciation 12.0 14.0 18.0 23.0 26.0 26.0 32.0 40.0 40.0 Other assets 16.0 18.0 180 Total assets B4.0 97.0 102 2 107.9 Accounts payable 3.1 3.3 Current Fabilities 2.5 2.0 29 3.1 35 35.0 26.5 Provisions and other liabilities 10.0 12 0 15.0 47.5 50 5 57.8 Common stock 25.0 20.0 30.0 11.5 16.5 14 5 Total shareholders equity 36.5 46.5 44 5 Total liabilities & shareholders equity 84.0 97.0 BALANCE CHECK 0.00 Cash flow Statements Forecast Base Year +2 +4 +5 27.0 20.0 12.0 15 MM 10.0 Cash flow from operations Investing Activities Investments in FRE (CAREX) Sale of FPE Investments in other assets Sale of other assets Cash flow from investment activities Issue of equity Equity retirement or treasury buybacks Retirement or repayment of debt Cash flow from financing activities Net cash flow for the year Ending cash balance Debt & Dividend Payment Schedule Forecast +1 #2 +4 Cash balance before debt & dividends 10 5.0 5.0 5.0 Debt drawn to meet min balance 5.0 2.0 20 20 2.0 2.0 20 Ending cash balance 50 50 Debt Schedules Forecast +3 +5 40.0 44.0 44.0 Debt added 6.0 2.0 2.0 20 Debt repaid 20 2.0 2.0 20 2.0 44.0 44.0 44.0 Interest 25 2.6 2.6 26 2.6
Step by Step Solution
There are 3 Steps involved in it

Get step-by-step solutions from verified subject matter experts