

Question: Performance Evaluation Case (Chap 18) : Use the data in the Excel file in Canvas titled Perf Analysis to answer the following questions: 1. Calculate
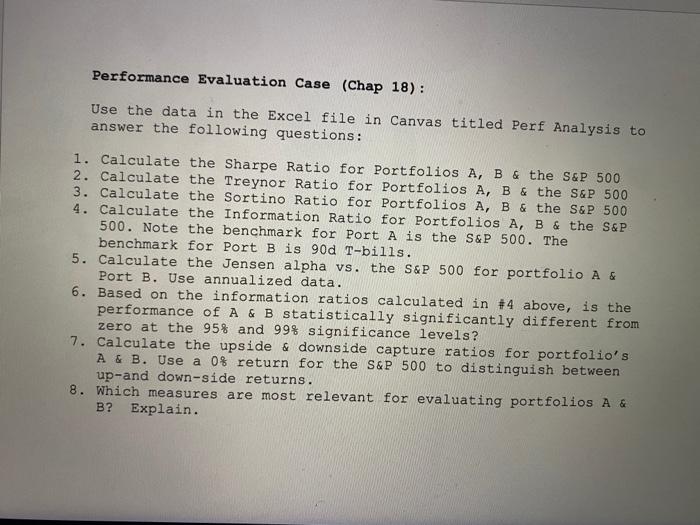
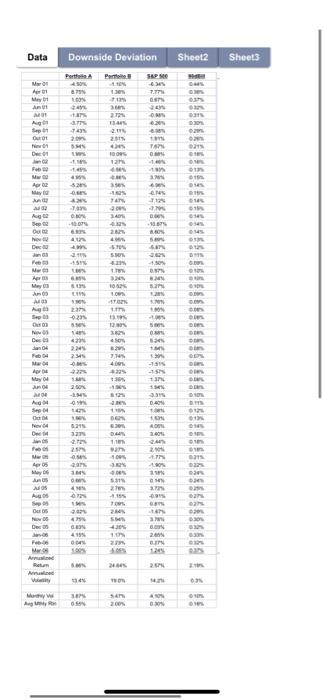
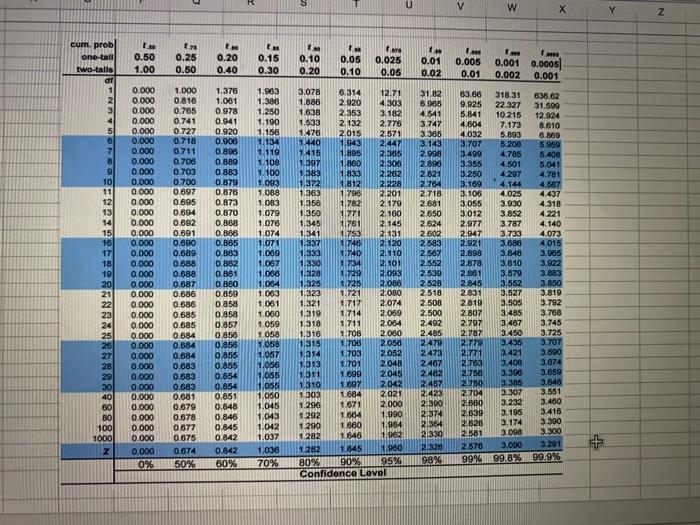
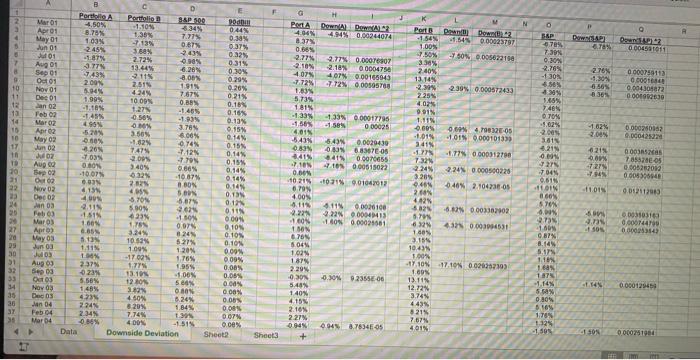
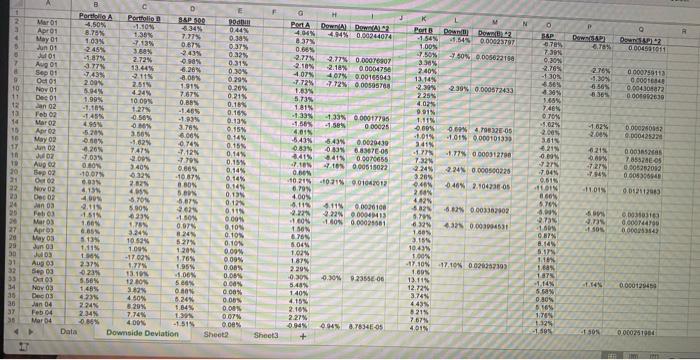
Performance Evaluation Case (Chap 18) : Use the data in the Excel file in Canvas titled Perf Analysis to answer the following questions: 1. Calculate the Sharpe Ratio for Portfolios A, B & the S&P 500 2. Calculate the Treynor Ratio for Portfolios A, B & the S&P 500 3. Calculate the Sortino Ratio for Portfolios A, B & the S&P 500 4. Calculate the Information Ratio for Portfolios A, B & the S&P 500. Note the benchmark for Port A is the S&P 500. The benchmark for Port Bis 90d T-bills. 5. Calculate the Jensen alpha vs. the S&P 500 for portfolio A & Port B. Use annualized data. 6. Based on the information ratios calculated in #4 above, is the performance of A & B statistically significantly different from zero at the 95% and 99% significance levels? 7. Calculate the upside & downside capture ratios for portfolio's A & B. Use a 0% return for the S&P 500 to distinguish between up-and down-side returns. 8. Which measures are most relevant for evaluating portfolios A & B? Explain. Data Sheet2 Sheets SK Meron fer Downside Deviation SAP 69 3. 2 2 13 20 2 SM M Our 20 SM Tom De 0 O 12 A oses 011 WD Aug Be . W Dec W LOS Sot . MES 10 A Amos A A Sep SA sezo WE MO dos 2 WO De dan 04 M Sunt SALE 4. May M - D. See OU ON 12 ON 25 an VT Me ww Et RE ME ware 2 A m -1:19 2001 Gure w 20 w De ME O GEN 411 00 WW 12 M A Motyw U V w Y Z ts 0.50 1.00 0.15 cum, prob one-tall two-tails df 1 IM 0.05 0.25 0.50 0.20 0.40 0.10 0.20 I. 0.005 0.01 0.025 0.05 0.30 0.01 0.02 0.001 0.10 0.0005 0.001 0.002 636.62 22 327 3 2.353 31.82 6965 4 541 3747 3 385 3.143 2908 2898 2821 1.397 2784 5 6 7 8 9 10 11 12 13 14 15 16 17 18 19 20 21 22 23 24 25 26 27 28 29 30 401 80 80 100 1000 Z 0.000 0.000 0.000 0.000 0.000 0.000 0.000 0.000 0.000 0.000 0.000 0.000 0.000 0.000 0.000 0.000 0.000 0.000 0.000 0.000 0.000 0.000 0.000 0.000 0.000 0.000 0.000 0.000 0.000 0.000 0.000 0.000 0.000 0.000 0.000 0.000 0% 1.000 0.816 0.765 0.741 0.727 0.718 0.711 0.708 0.703 0.700 0.697 0.695 0.694 0.692 0.691 0.690 0.689 0.688 0.688 0.687 0.686 0.686 0.685 0.685 0.684 0.684 0.684 0.683 0.583 0.683 0.681 0.679 0.678 0677 0675 0.674 50% 1.370 1.061 0.978 0.941 0.920 0.906 0.896 0.889 0.883 0.879 0.876 0.873 0.870 0.868 0.866 0.865 0.883 0.862 0.861 0.860 0.850 0.858 0.858 0.857 0.856 0.858 0.855 0.855 0.854 0.854 0.851 0.848 0.846 0.845 0.842 0.842 60% 1.983 1.386 1.250 1.190 1.156 1.134 11.119 1.108 1.100 1.093 1.088 1.083 1.079 1.076 1.074 1.071 1.069 1.067 1.066 1.064 1.063 1061 1.060 1.059 1.058 11.058 1,057 1.056 1,055 1,055 1.050 1.045 1.043 1.042 1.037 1,036 70% 3.078 6.314 12.71 1.886 2.920 4.303 1.638 3.182 1.533 2.132 2.276 1476 2.015 2,571 1.440 1.943 2.447 1.416 1.895 2.305 11.860 2.306 1.383 1833 2.262 1.372 1812 2.228 1.363 1.796 2.201 1.356 1.782 2. 179 1.350 1.771 2.100 1.345 1761 2.145 1341 1.753 2. 131 1.337 1746 2120 1.333 1.740 2. 110 1330 1.734 2.101 1.328 1.720 2.093 1.325 1.725 2.086 1.323 1.721 2.080 1.321 1.712 2.074 1,319 1.714 2.089 1.318 1.711 2.064 1.316 1.708 2.080 1.315 1.708 2050 1.314 1.703 2.052 1.313 1.701 2048 1311 1.699 2.045 1.310 1.697 2.042 1.303 1.684 2021 1.296 1671 2.000 1.292 1.684 1.990 290 1.680 1.984 1 282 1.646 1.962 1.282 1.645 1.900 80% 90% 95% Confidenca Lovol 2.718 2.681 2.650 2.624 2602 2583 2587 2.552 2530 2528 2.518 2.500 2.500 2.492 2.485 2479 2473 2.467 2.402 2.457 2.423 2.300 2.374 2364 2.330 2.3.20 9896 63.66 318,31 9.925 31.590 5.841 10 215 12 924 4.804 7.173 8.610 4,032 5.893 6.869 3.707 5.208 5.950 3.400 4.785 5.400 3.355 4.501 5.041 3.250 4297 4.781 3.169 4.144 4.587 3.106 4.025 4.437 3.055 3.930 4 318 3,012 3.852 4221 2.977 3.787 4.140 2.947 3.733 4,073 2.821 3.686 4.015 2.898 3.646 3.885 2.878 3.610 3.822 2.861 3.579 3.883 2.845 3.562 3.850 2831 3.527 3.819 2819 3.505 3.792 2.807 3.485 3.788 2.797 3.467 3.745 2.787 3.450 3.725 2.779 3.438 3.707 2.771 3.421 3.600 2.763 3.408 3.874 2786 3.396 3.659 2750 3.385 3.646 2.704 3.307 3.551 2680 3232 3.460 2.839 3.196 3.416 2.826 3.174 3.390 2581 3.098 3300 2.576 3.291 99%99.8% 99.9% 3.000 + N DO 3. 00045001 5 7 BAP 7.392 0.0% 2.765 -130 276% -1.30% 6.56% - 365 0000750113 Ooo 0.004304072 00002630 1000 0.30 430% X5% 74 1.325 0.134 3.78 10 11 13 13 14 10 10 17 TA TE 10 30 22 2009 00002 0.0002221 2008 0 SP . Porto A Portfolio Mar 01 4.50% 8&P 500 -1.101 pod 5.34% Apr 01 8.79% 044% 1.35% May 01 7.77% 103N 7139 0.38% Jan 01 0.87% 2.45% 0.37% EN 2.44 Ju 01 0.22% -1.87% Aug 01 2.72% 0.30 0.315 -3.77 13.44% 28 Sep 01 7.43% 2.11% 0.30 -20% Oct 01 200N 2515 0.29% Nov 01 5.94% 424 0.20% Dec 01 7.67% 1.99% 0.21 Jan 02 0.10 -1.10% 1.27 -1.45% 0.16% Feb 02 -145 0.58% -1.03% Mar 02 495 OM OX Apr 02 -5209 0.15% 3.56% 0.00% May 03 0.14 -1.825 Jun 02 0.15 4.20 7,47 JOZ 7035 -7123 0.145 2.0 -7705 ON 340% 0.15% 09 0.66% B, v 0.145 -10.07% 10 87% O 02 0.14% ON Nov 02 WA 32 880 0.14 4154 Dec 02 400 0.13 STON 6.075 0.12 Aan 03 $90 2.0 0.11N Feb 423 - SON Maro . 0.07 Apr.) 6.85 3.24 8245 May 03 3.13 10.53% 527 Jun 03 1.11% 1.09% 0.00 1205 Juos 10 -17021 1.76% 0.09% Aug 03 237% 177 1955 Sep 03 23 0.00% 13.10 0.05% Oct 03 5.58% 12.10 50% 0.00 Nov 03 1489 3.12 0 0% Decos 4. 460N 8.26% 0.00% Jan 04 2.24% 8 20% 1,84% 0.0 Feb 04 2345 7.74% 1.30 0.07 Mar 04 -0.06% 400% -1.51% 0.00% Data Downside Deviation Sheet Shoot G POLA DownA DAL? 4.06% 41%0.00244074 8.37 0.66% 2.77% 2.77% 0.00016907 2.10% 2.18 00004750 407 407 000165945 2.72% 772 000505708 1.03% 5.73% 1815 -133 0.00017795 -1565 000025 4018 5433 6.490.0029430 03 0.33% 68307E08 41 0.000455 4105 0.00615022 0.00% 1021 10215 0.01042012 0.79% 00% 4.11% 4.115 00100 2.22 2.22 0.00040413 1.ON 1 0.00021001 13 678 5045 102 187% 2.20 -0.04 92355E06 5:48 1 40% 4155 2.16% 2.27% 0.94% 09456.7634E05 + Porto DM Down 42 -1.549 -1.5445 000023717 1.00 7.50% 750 0.0056221 3.3% 2.40% 13.14% 2.30 2.394000572433 2254 4.02 9918 1.115 0.00% 0 4.798326-05 1019 11 0000101333 2418 1779 0000312700 732 321 2.24 0.000500220 20 948 -0.46% 2.104738-05 2 CON 4.42% 5025 50 -0.02 0.003302002 07 40.00394531 3.15 10.43 1.00% -17,10% +17101 0.020907193 100% 13.11% 12.12% 3.74% 4.43% 521% 3.02% 200 361 4219 0.01 7045 0615 IN 0.00% 570 0215 0.01% 727 794 4321 000s 7005 0.0062200 0.0040040 11.01 CE 24 M 001 32 NE -2.73 20 27 20 ps 0510310 0.000144700 0 0253143 0.10 0.10% TON 100 0 87% 8.14 5.17 1.16 51 32 100 0- 14 34 NO 0.000129459 C DE IC 18 14% 5 0.80 6.16 1.70 SEE 4 IN 1 SON 0.000201900 D N Dowd res 12 060453011 o BAP 0789 7.398 0,30% 2.76 -130% 0.30 278% -1.30% 6565 0000159113 O co 0.00430172 0.000030 10 Ne 0.30 430% 5.48% 71 134 07014 -156% 12 13 14 10 10 17 TA TO 400% 3.02% 2001 18 0 SP NOVO 0215 Porto A Portfolio Mar 01 8&P 500 Podun -1.10 Apr 01 5349 8.79% 1.35 7.77 May 01 103 7139 0.38% in 01 0.67 245 0.37% 388% 2.43% Ju 01 -1.37% 0.22% 2724 990% 0.315 13.45 6.26% Sep 01 7.435 Oct 01 2115 2.06% 200N 0.29% 2.519 1915 Nov 01 4.24% 0.26% Dec 01 7.67% 1.99% 100% 0215 Jan 02 0.18% -1.10% 1.27% -1.465 Feb 02 0.105 -145 0.56% -1.03% Maroz 495 OM 3.78% Apr 0.15% -5.20% 3.56% 0.14% May 02 -1.82 0.15 Jun 02 0.265 7474 J. 7035 -7,123 0.145 2.0 -70 ON 0.15% Aup ce 0.00 0.105 02 -10.07 -10.87% O 02 0.03 0.14% Nov 02 2025 0.00% 0.14 4.13 Dec 02 400 0.13N 6,075 0.12 an 03 SBON 2.625 0.11N Feto 23% Maros - SON 1.78 0.07% Apr.) 6.85 9.10 3.24 824 0.10% May 03 5.134 10 53% 577 Jun 03 1.11% 1.09% Juos 1205 009 19 -1702 Aug 03 237 009 1.77 1969 23% Sep 03 0.00% 13.10 -1.06% 0.08 Oct 03 5.56% 120 5 0.00 Nov 03 1485 3.82 0.00% Dec 03 4. 4509 8.24% 0.00 Jan 04 2.24 8 20% 1,84% 0.00 Feb 04 7.74 1 0.07 Mar 04 400% -1.51% O ON Data Downside Deviation Sheet2 40 632) 0 0 0.00042220 00035 78557 000122010 0.000000 Porta Down Dow? 404 41% 0.00244074 37% 0.68% 2.77% 2.77% 0.00016907 2.10% 2.18% 0000475 407 4078 000166945 7.72% 772 00505708 1.63% 5.73% 181% -1335 -133 000017795 -1.58% 000025 4.018 5435 6.43 0.0029430 0.83 68307E08 3415 0.0070655 7.10 4105 0.00515022 0.00% 1021 021 901042012 0.799 100% 1.11% 4.115 0020100 2.228 2.22 0.0004413 1.COM N 0.0002001 130 6765 5045 1024 187% 2.29 M 0.3% 9235500 5:48 1 40% 415% 2.18% 2.27% 0.94% 09458.7634E-5 + Porto DUD2 -1.549 -1.545 0.00023797 1.00% 7.50% 50_0.0056221 3.30 2.40% 13.14% 2.30 2309 0.000672493 225 4.02 SIN 1.115 0.00% 0647901205 -1.01% 1.19 0.000101333 3419 -1978 -1.779 0000312790 7328 3210 2.24 0.000500225 ON 94% -0.46% 2.104738 OS 2 CON 442% 5021 -0.020003302002 032 5.79 43 0.00394531 15% 10.43 1.00% -17,10% +17.100.02095710) 1.00 13.11% 12.72% 3.74% 4.43 521% 7.67% 4 DIN 4219 0 San 7.04% 0618 IN 60 727 -7949 11.01 22 23 24 0.012812913 EN 6709 WAL M AAN UN 00 NET 3101 0.000144700 0000253847 100 SOS 30 27 20 30 51 32 0.105 TOS 0- 9.30 16 0.87% 8.14 5.17 1.16 Bas 187% 149 5 0.80 $164 170 1.125 -10 14 34 35 0.009 0.000129452 DE IC 2.34 SON Sheet3 0000291964 Performance Evaluation Case (Chap 18) : Use the data in the Excel file in Canvas titled Perf Analysis to answer the following questions: 1. Calculate the Sharpe Ratio for Portfolios A, B & the S&P 500 2. Calculate the Treynor Ratio for Portfolios A, B & the S&P 500 3. Calculate the Sortino Ratio for Portfolios A, B & the S&P 500 4. Calculate the Information Ratio for Portfolios A, B & the S&P 500. Note the benchmark for Port A is the S&P 500. The benchmark for Port Bis 90d T-bills. 5. Calculate the Jensen alpha vs. the S&P 500 for portfolio A & Port B. Use annualized data. 6. Based on the information ratios calculated in #4 above, is the performance of A & B statistically significantly different from zero at the 95% and 99% significance levels? 7. Calculate the upside & downside capture ratios for portfolio's A & B. Use a 0% return for the S&P 500 to distinguish between up-and down-side returns. 8. Which measures are most relevant for evaluating portfolios A & B? Explain. Data Sheet2 Sheets SK Meron fer Downside Deviation SAP 69 3. 2 2 13 20 2 SM M Our 20 SM Tom De 0 O 12 A oses 011 WD Aug Be . W Dec W LOS Sot . MES 10 A Amos A A Sep SA sezo WE MO dos 2 WO De dan 04 M Sunt SALE 4. May M - D. See OU ON 12 ON 25 an VT Me ww Et RE ME ware 2 A m -1:19 2001 Gure w 20 w De ME O GEN 411 00 WW 12 M A Motyw U V w Y Z ts 0.50 1.00 0.15 cum, prob one-tall two-tails df 1 IM 0.05 0.25 0.50 0.20 0.40 0.10 0.20 I. 0.005 0.01 0.025 0.05 0.30 0.01 0.02 0.001 0.10 0.0005 0.001 0.002 636.62 22 327 3 2.353 31.82 6965 4 541 3747 3 385 3.143 2908 2898 2821 1.397 2784 5 6 7 8 9 10 11 12 13 14 15 16 17 18 19 20 21 22 23 24 25 26 27 28 29 30 401 80 80 100 1000 Z 0.000 0.000 0.000 0.000 0.000 0.000 0.000 0.000 0.000 0.000 0.000 0.000 0.000 0.000 0.000 0.000 0.000 0.000 0.000 0.000 0.000 0.000 0.000 0.000 0.000 0.000 0.000 0.000 0.000 0.000 0.000 0.000 0.000 0.000 0.000 0.000 0% 1.000 0.816 0.765 0.741 0.727 0.718 0.711 0.708 0.703 0.700 0.697 0.695 0.694 0.692 0.691 0.690 0.689 0.688 0.688 0.687 0.686 0.686 0.685 0.685 0.684 0.684 0.684 0.683 0.583 0.683 0.681 0.679 0.678 0677 0675 0.674 50% 1.370 1.061 0.978 0.941 0.920 0.906 0.896 0.889 0.883 0.879 0.876 0.873 0.870 0.868 0.866 0.865 0.883 0.862 0.861 0.860 0.850 0.858 0.858 0.857 0.856 0.858 0.855 0.855 0.854 0.854 0.851 0.848 0.846 0.845 0.842 0.842 60% 1.983 1.386 1.250 1.190 1.156 1.134 11.119 1.108 1.100 1.093 1.088 1.083 1.079 1.076 1.074 1.071 1.069 1.067 1.066 1.064 1.063 1061 1.060 1.059 1.058 11.058 1,057 1.056 1,055 1,055 1.050 1.045 1.043 1.042 1.037 1,036 70% 3.078 6.314 12.71 1.886 2.920 4.303 1.638 3.182 1.533 2.132 2.276 1476 2.015 2,571 1.440 1.943 2.447 1.416 1.895 2.305 11.860 2.306 1.383 1833 2.262 1.372 1812 2.228 1.363 1.796 2.201 1.356 1.782 2. 179 1.350 1.771 2.100 1.345 1761 2.145 1341 1.753 2. 131 1.337 1746 2120 1.333 1.740 2. 110 1330 1.734 2.101 1.328 1.720 2.093 1.325 1.725 2.086 1.323 1.721 2.080 1.321 1.712 2.074 1,319 1.714 2.089 1.318 1.711 2.064 1.316 1.708 2.080 1.315 1.708 2050 1.314 1.703 2.052 1.313 1.701 2048 1311 1.699 2.045 1.310 1.697 2.042 1.303 1.684 2021 1.296 1671 2.000 1.292 1.684 1.990 290 1.680 1.984 1 282 1.646 1.962 1.282 1.645 1.900 80% 90% 95% Confidenca Lovol 2.718 2.681 2.650 2.624 2602 2583 2587 2.552 2530 2528 2.518 2.500 2.500 2.492 2.485 2479 2473 2.467 2.402 2.457 2.423 2.300 2.374 2364 2.330 2.3.20 9896 63.66 318,31 9.925 31.590 5.841 10 215 12 924 4.804 7.173 8.610 4,032 5.893 6.869 3.707 5.208 5.950 3.400 4.785 5.400 3.355 4.501 5.041 3.250 4297 4.781 3.169 4.144 4.587 3.106 4.025 4.437 3.055 3.930 4 318 3,012 3.852 4221 2.977 3.787 4.140 2.947 3.733 4,073 2.821 3.686 4.015 2.898 3.646 3.885 2.878 3.610 3.822 2.861 3.579 3.883 2.845 3.562 3.850 2831 3.527 3.819 2819 3.505 3.792 2.807 3.485 3.788 2.797 3.467 3.745 2.787 3.450 3.725 2.779 3.438 3.707 2.771 3.421 3.600 2.763 3.408 3.874 2786 3.396 3.659 2750 3.385 3.646 2.704 3.307 3.551 2680 3232 3.460 2.839 3.196 3.416 2.826 3.174 3.390 2581 3.098 3300 2.576 3.291 99%99.8% 99.9% 3.000 + N DO 3. 00045001 5 7 BAP 7.392 0.0% 2.765 -130 276% -1.30% 6.56% - 365 0000750113 Ooo 0.004304072 00002630 1000 0.30 430% X5% 74 1.325 0.134 3.78 10 11 13 13 14 10 10 17 TA TE 10 30 22 2009 00002 0.0002221 2008 0 SP . Porto A Portfolio Mar 01 4.50% 8&P 500 -1.101 pod 5.34% Apr 01 8.79% 044% 1.35% May 01 7.77% 103N 7139 0.38% Jan 01 0.87% 2.45% 0.37% EN 2.44 Ju 01 0.22% -1.87% Aug 01 2.72% 0.30 0.315 -3.77 13.44% 28 Sep 01 7.43% 2.11% 0.30 -20% Oct 01 200N 2515 0.29% Nov 01 5.94% 424 0.20% Dec 01 7.67% 1.99% 0.21 Jan 02 0.10 -1.10% 1.27 -1.45% 0.16% Feb 02 -145 0.58% -1.03% Mar 02 495 OM OX Apr 02 -5209 0.15% 3.56% 0.00% May 03 0.14 -1.825 Jun 02 0.15 4.20 7,47 JOZ 7035 -7123 0.145 2.0 -7705 ON 340% 0.15% 09 0.66% B, v 0.145 -10.07% 10 87% O 02 0.14% ON Nov 02 WA 32 880 0.14 4154 Dec 02 400 0.13 STON 6.075 0.12 Aan 03 $90 2.0 0.11N Feb 423 - SON Maro . 0.07 Apr.) 6.85 3.24 8245 May 03 3.13 10.53% 527 Jun 03 1.11% 1.09% 0.00 1205 Juos 10 -17021 1.76% 0.09% Aug 03 237% 177 1955 Sep 03 23 0.00% 13.10 0.05% Oct 03 5.58% 12.10 50% 0.00 Nov 03 1489 3.12 0 0% Decos 4. 460N 8.26% 0.00% Jan 04 2.24% 8 20% 1,84% 0.0 Feb 04 2345 7.74% 1.30 0.07 Mar 04 -0.06% 400% -1.51% 0.00% Data Downside Deviation Sheet Shoot G POLA DownA DAL? 4.06% 41%0.00244074 8.37 0.66% 2.77% 2.77% 0.00016907 2.10% 2.18 00004750 407 407 000165945 2.72% 772 000505708 1.03% 5.73% 1815 -133 0.00017795 -1565 000025 4018 5433 6.490.0029430 03 0.33% 68307E08 41 0.000455 4105 0.00615022 0.00% 1021 10215 0.01042012 0.79% 00% 4.11% 4.115 00100 2.22 2.22 0.00040413 1.ON 1 0.00021001 13 678 5045 102 187% 2.20 -0.04 92355E06 5:48 1 40% 4155 2.16% 2.27% 0.94% 09456.7634E05 + Porto DM Down 42 -1.549 -1.5445 000023717 1.00 7.50% 750 0.0056221 3.3% 2.40% 13.14% 2.30 2.394000572433 2254 4.02 9918 1.115 0.00% 0 4.798326-05 1019 11 0000101333 2418 1779 0000312700 732 321 2.24 0.000500220 20 948 -0.46% 2.104738-05 2 CON 4.42% 5025 50 -0.02 0.003302002 07 40.00394531 3.15 10.43 1.00% -17,10% +17101 0.020907193 100% 13.11% 12.12% 3.74% 4.43% 521% 3.02% 200 361 4219 0.01 7045 0615 IN 0.00% 570 0215 0.01% 727 794 4321 000s 7005 0.0062200 0.0040040 11.01 CE 24 M 001 32 NE -2.73 20 27 20 ps 0510310 0.000144700 0 0253143 0.10 0.10% TON 100 0 87% 8.14 5.17 1.16 51 32 100 0- 14 34 NO 0.000129459 C DE IC 18 14% 5 0.80 6.16 1.70 SEE 4 IN 1 SON 0.000201900 D N Dowd res 12 060453011 o BAP 0789 7.398 0,30% 2.76 -130% 0.30 278% -1.30% 6565 0000159113 O co 0.00430172 0.000030 10 Ne 0.30 430% 5.48% 71 134 07014 -156% 12 13 14 10 10 17 TA TO 400% 3.02% 2001 18 0 SP NOVO 0215 Porto A Portfolio Mar 01 8&P 500 Podun -1.10 Apr 01 5349 8.79% 1.35 7.77 May 01 103 7139 0.38% in 01 0.67 245 0.37% 388% 2.43% Ju 01 -1.37% 0.22% 2724 990% 0.315 13.45 6.26% Sep 01 7.435 Oct 01 2115 2.06% 200N 0.29% 2.519 1915 Nov 01 4.24% 0.26% Dec 01 7.67% 1.99% 100% 0215 Jan 02 0.18% -1.10% 1.27% -1.465 Feb 02 0.105 -145 0.56% -1.03% Maroz 495 OM 3.78% Apr 0.15% -5.20% 3.56% 0.14% May 02 -1.82 0.15 Jun 02 0.265 7474 J. 7035 -7,123 0.145 2.0 -70 ON 0.15% Aup ce 0.00 0.105 02 -10.07 -10.87% O 02 0.03 0.14% Nov 02 2025 0.00% 0.14 4.13 Dec 02 400 0.13N 6,075 0.12 an 03 SBON 2.625 0.11N Feto 23% Maros - SON 1.78 0.07% Apr.) 6.85 9.10 3.24 824 0.10% May 03 5.134 10 53% 577 Jun 03 1.11% 1.09% Juos 1205 009 19 -1702 Aug 03 237 009 1.77 1969 23% Sep 03 0.00% 13.10 -1.06% 0.08 Oct 03 5.56% 120 5 0.00 Nov 03 1485 3.82 0.00% Dec 03 4. 4509 8.24% 0.00 Jan 04 2.24 8 20% 1,84% 0.00 Feb 04 7.74 1 0.07 Mar 04 400% -1.51% O ON Data Downside Deviation Sheet2 40 632) 0 0 0.00042220 00035 78557 000122010 0.000000 Porta Down Dow? 404 41% 0.00244074 37% 0.68% 2.77% 2.77% 0.00016907 2.10% 2.18% 0000475 407 4078 000166945 7.72% 772 00505708 1.63% 5.73% 181% -1335 -133 000017795 -1.58% 000025 4.018 5435 6.43 0.0029430 0.83 68307E08 3415 0.0070655 7.10 4105 0.00515022 0.00% 1021 021 901042012 0.799 100% 1.11% 4.115 0020100 2.228 2.22 0.0004413 1.COM N 0.0002001 130 6765 5045 1024 187% 2.29 M 0.3% 9235500 5:48 1 40% 415% 2.18% 2.27% 0.94% 09458.7634E-5 + Porto DUD2 -1.549 -1.545 0.00023797 1.00% 7.50% 50_0.0056221 3.30 2.40% 13.14% 2.30 2309 0.000672493 225 4.02 SIN 1.115 0.00% 0647901205 -1.01% 1.19 0.000101333 3419 -1978 -1.779 0000312790 7328 3210 2.24 0.000500225 ON 94% -0.46% 2.104738 OS 2 CON 442% 5021 -0.020003302002 032 5.79 43 0.00394531 15% 10.43 1.00% -17,10% +17.100.02095710) 1.00 13.11% 12.72% 3.74% 4.43 521% 7.67% 4 DIN 4219 0 San 7.04% 0618 IN 60 727 -7949 11.01 22 23 24 0.012812913 EN 6709 WAL M AAN UN 00 NET 3101 0.000144700 0000253847 100 SOS 30 27 20 30 51 32 0.105 TOS 0- 9.30 16 0.87% 8.14 5.17 1.16 Bas 187% 149 5 0.80 $164 170 1.125 -10 14 34 35 0.009 0.000129452 DE IC 2.34 SON Sheet3 0000291964
Step by Step Solution
There are 3 Steps involved in it

Get step-by-step solutions from verified subject matter experts