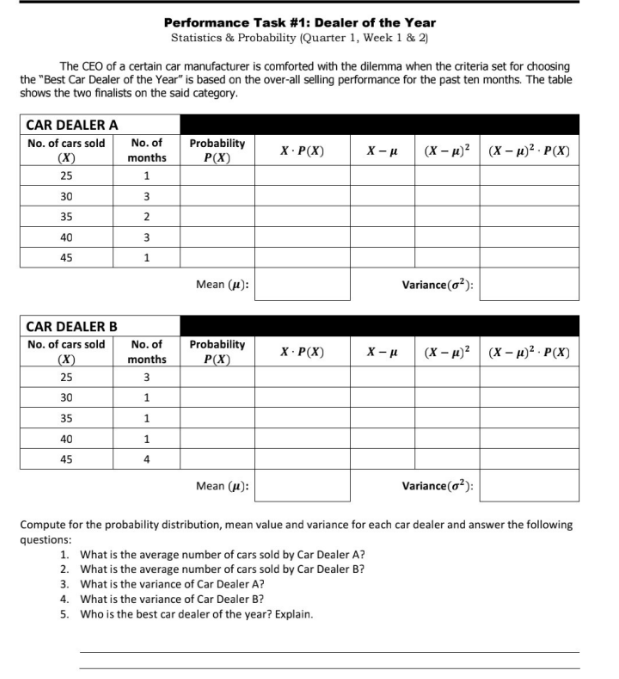
Question: Performance Task #1: Dealer of the Year Statistics & Probability (Quarter 1, Week 1 & 2) The CEO of a certain car manufacturer is comforted

Performance Task #1: Dealer of the Year
Performance Task #1: Dealer of the Year Statistics & Probability (Quarter 1, Week 1 & 2) The CEO of a certain car manufacturer is comforted with the dilemma when the criteria set for choosing the "Best Car Dealer of the Year" is based on the over-all selling performance for the past ten months. The table shows the two finalists on the said category. CAR DEALER A No. of cars sold No. of Probability (X) months P(X X . P(X) X- H (X - 1)2 (X - H)2 . P(X) 25 1 30 3 35 2 40 3 45 1 Mean (H): Variance (oz): CAR DEALER B No. of cars sold No. of Probability X - P(X) X - H (X) (X - 1) ? months P(X) (X - H) . P(X) 25 3 30 1 35 40 1 45 4 Mean (1): Variance (a]): Compute for the probability distribution, mean value and variance for each car dealer and answer the following questions: 1. What is the average number of cars sold by Car Dealer A? 2. What is the average number of cars sold by Car Dealer B? 3. What is the variance of Car Dealer A? 4. What is the variance of Car Dealer B? 5. Who is the best car dealer of the year? Explain

Step by Step Solution

There are 3 Steps involved in it

1 Expert Approved Answer
Step: 1 Unlock blur-text-image
Question Has Been Solved by an Expert!

Get step-by-step solutions from verified subject matter experts

Step: 2 Unlock
Step: 3 Unlock

Students Have Also Explored These Related Mathematics Questions!