

Question: Performance Tasks PT 1- Regression Analysis 1 2 3 4 5 6 7 8 9 2. 3. 4. Xt 5.0 0 5.0 6 5.1
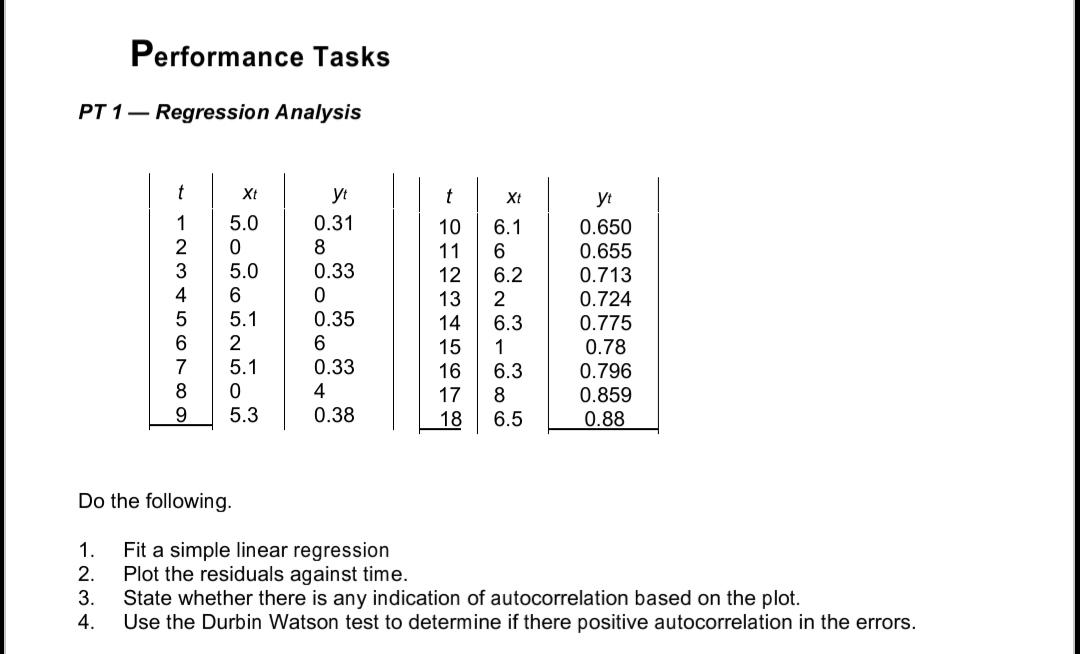
Performance Tasks PT 1- Regression Analysis 1 2 3 4 5 6 7 8 9 2. 3. 4. Xt 5.0 0 5.0 6 5.1 2 5.1 0 5.3 yt 0.31 8 0.33 0 0.35 6 0.33 4 0.38 t 10 11 12 13 2 14 15 16 Xt 6.1 6 6.2 6.3 1 6.3 17 8 18 6.5 yt 0.650 0.655 0.713 0.724 0.775 0.78 0.796 0.859 0.88 Do the following. 1. Fit a simple linear regression Plot the residuals against time. State whether there is any indication of autocorrelation based on the plot. Use the Durbin Watson test to determine if there positive autocorrelation in the errors.
Step by Step Solution
3.49 Rating (152 Votes )
There are 3 Steps involved in it
1 Fit a simple linear regression A simple linear regression can be used to predict the value of the dependent variable y using the independent variabl... View full answer

Get step-by-step solutions from verified subject matter experts