

Question: PERT/CPM Exercise Activity Optimistic Time Realistic Time Pessimistic Time Expected Time Preceding Activity Critical Path/Slack Time 1. Requirements Collection 2. Screen Design 3. Report Design
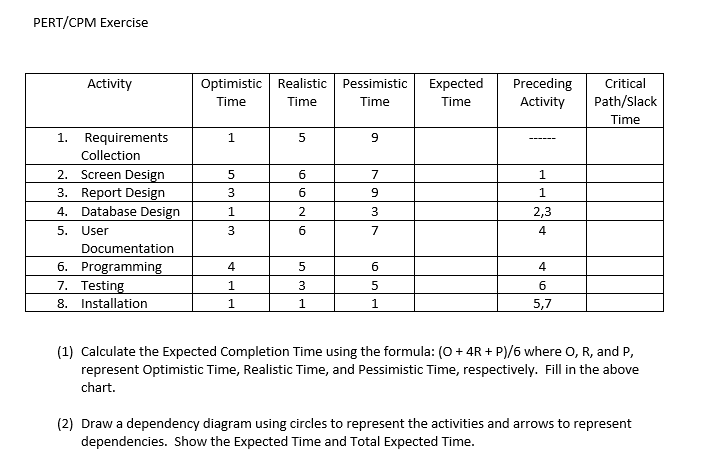
PERT/CPM Exercise Activity Optimistic Time Realistic Time Pessimistic Time Expected Time Preceding Activity Critical Path/Slack Time 1. Requirements Collection 2. Screen Design 3. Report Design 4. Database Design 5. User Documentation 6. Programming 7. Testing 8. Installation 3 1 1 5 1 1 5,7 (1) Calculate the Expected Completion Time using the formula: (0 +4R+P)/6 where O, R, and P, represent Optimistic Time, Realistic Time, and Pessimistic Time, respectively. Fill in the above chart. (2) Draw a dependency diagram using circles to represent the activities and arrows to represent dependencies. Show the Expected Time and Total Expected Time. PERT/CPM Exercise Activity Optimistic Time Realistic Time Pessimistic Time Expected Time Preceding Activity Critical Path/Slack Time 1. Requirements Collection 2. Screen Design 3. Report Design 4. Database Design 5. User Documentation 6. Programming 7. Testing 8. Installation 3 1 1 5 1 1 5,7 (1) Calculate the Expected Completion Time using the formula: (0 +4R+P)/6 where O, R, and P, represent Optimistic Time, Realistic Time, and Pessimistic Time, respectively. Fill in the above chart. (2) Draw a dependency diagram using circles to represent the activities and arrows to represent dependencies. Show the Expected Time and Total Expected Time
Step by Step Solution
There are 3 Steps involved in it

Get step-by-step solutions from verified subject matter experts