

Pharmaceuticals is a small to mid size pharmaceutical company. The accounting department began extending its historical records
Question:
Pharmaceuticals is a small to mid size pharmaceutical company. The accounting department began extending its historical records by recording the sales volume for each month over the past four years, starting in January.
The company engages in various kinds of direct to consumer advertising and, until recently, has never studied the effect its advertising dollars have on sales, although some data had also been collected. Their hope was that after several months the collected data could be examined to possibly reveal any relationships that would help in future advertising expenditures.
The accounting department besides extending its historical records by recording the sales volume for each month, they also collected advertising dollars for both magazine and TV spots. They also recorded both these values lagged one and two months. This was done because some people on the executive committee thought that sales might lag advertising expenditures rather than respond in the month the ads appeared. It was also believed that sales experienced a seasonal effect and management further wondered about any trend in the sales volume. Finally, it was believed that Alomega’s advertising dollars might have an effect on its major competitors’ advertising budgets the following month. For each following month it was decided that competitors’ advertising could be classified as: (1): little; (2): a moderate amount, or; (3): a great amount.
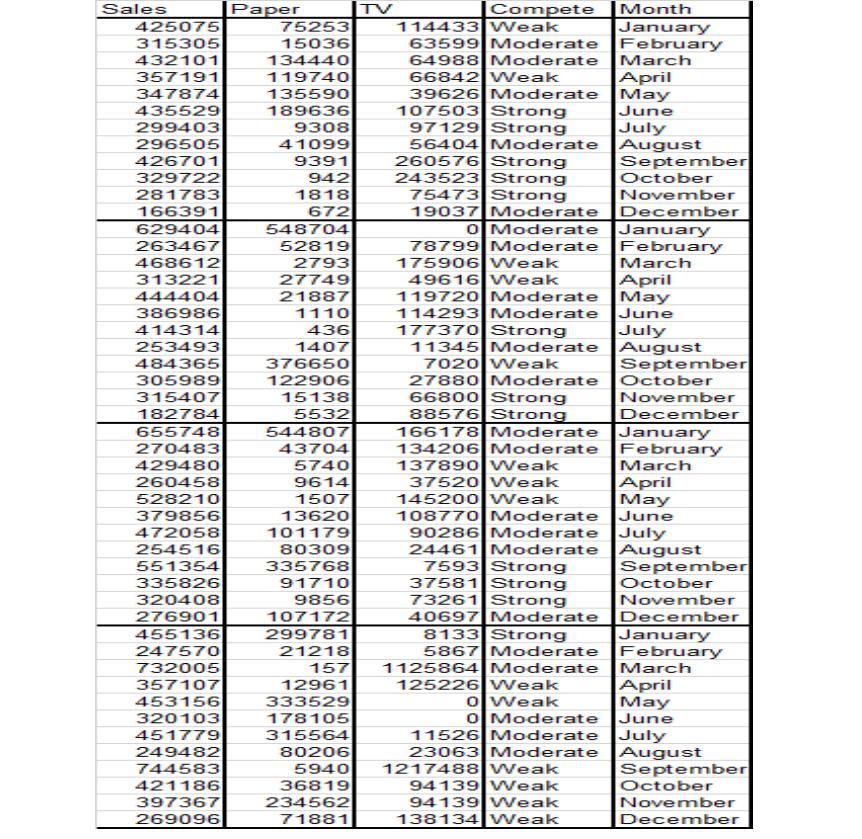
After a few months of data collection and analysis of past records, the accounting department completed an Excel file using the following variables:
Sales dollars
Magazine advertising dollars
TV advertising dollars
Code 1, 2, or 3 to indicate competitors’ advertising efforts the following month.
The data is in thetable below.
1.I build a 3-period moving average model.
2. build an exponential model, using α = .1.
3. Evaluate the two above models, i.e., which one is the best and explain why.
4. build a regression model with only the time series components—trend and seasonal components.
5., evaluate the above model, i.e., is it a good model? If so, why, or if not, why? Consider all the appropriate tests, α = 0.05. (explain your conclusions).
6. Using the model you developed in 1 (of part 2), i forecast the next 12 months (in the future).
7.Build a regression model with only the causal variables, paper advertising, tv advertising, and competitors’ advertising (complete).
8. evaluate the above model, i.e., is it a good model? If so, why, or if not, why? Consider all the appropriate tests, α = 0.05. (explain your conclusions).
9. Compare the models, moving average, exponential smoothing, classical decomposition, regression with time series and regression with causal variables, which one is the best and explain why.
Expert Answer:


Fundamentals of Cost Accounting
ISBN: 978-1259565403
5th edition
Authors: William Lanen, Shannon Anderson, Michael Maher
