

Question: PHY 2054 Data Analysis Part 2 Name 1. Go to the PhET Physics Simulation webite. 2. Scroll down and click on Curve Fitting. 3. Use
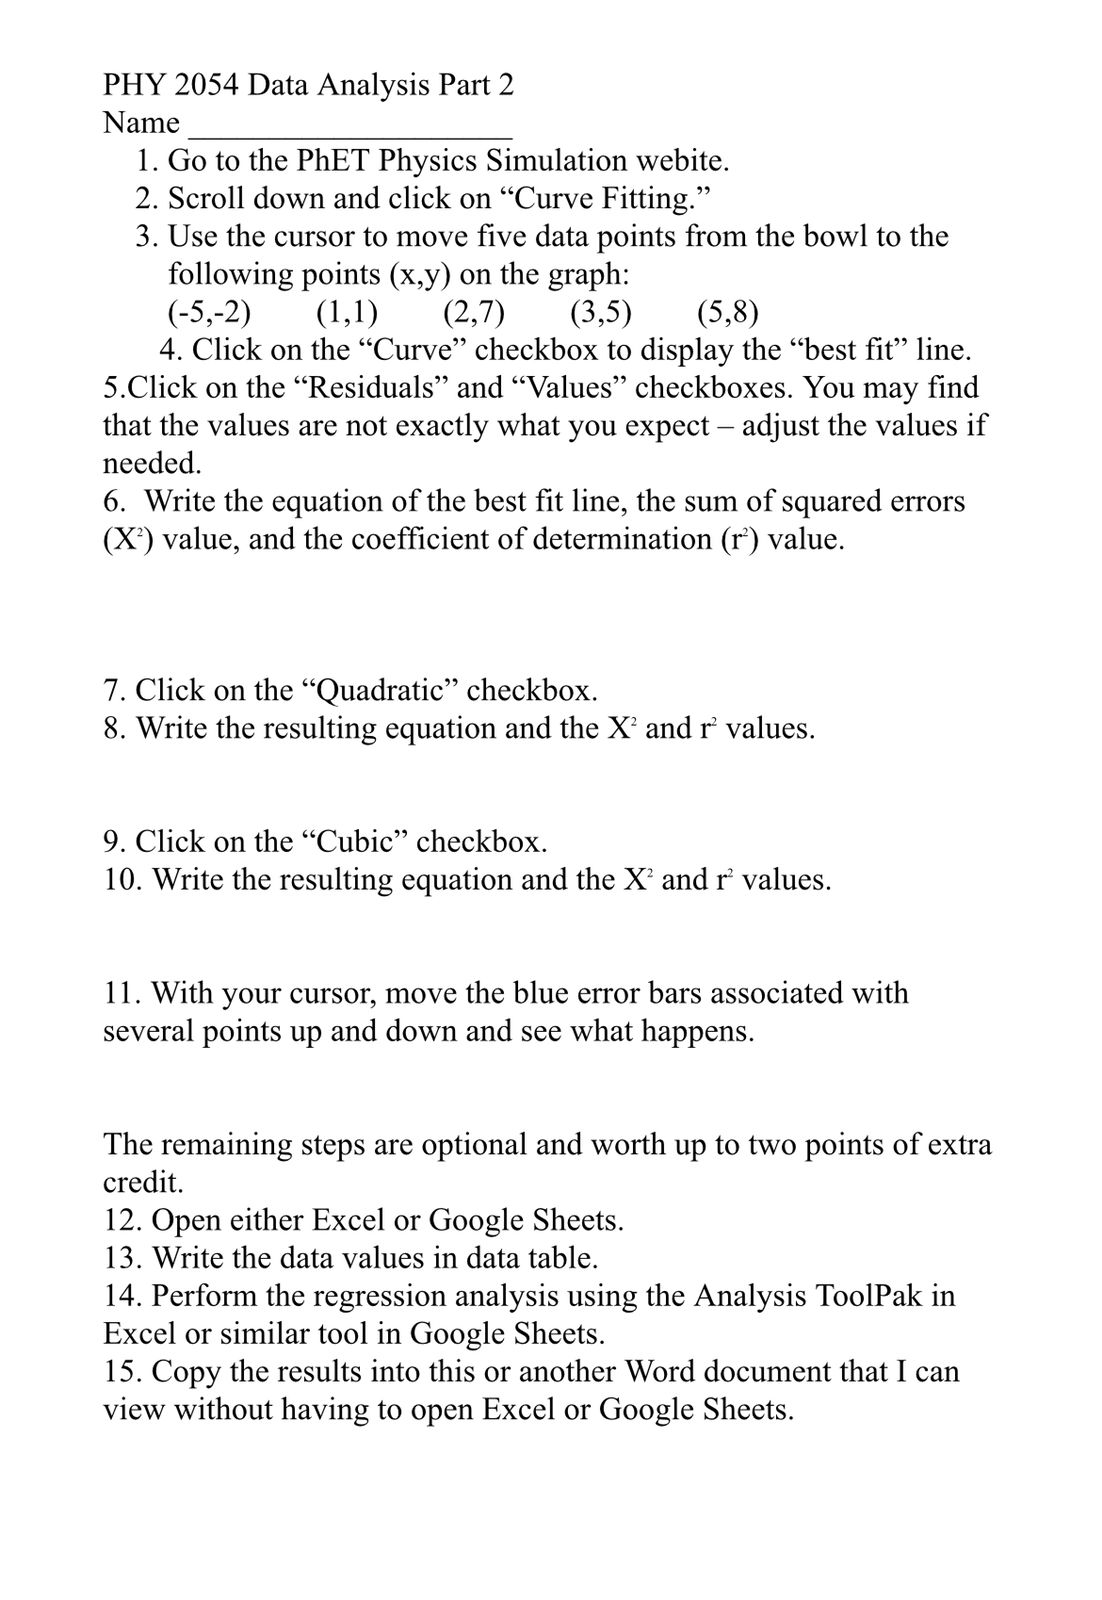

PHY 2054 Data Analysis Part 2 Name 1. Go to the PhET Physics Simulation webite. 2. Scroll down and click on \"Curve Fitting.\" 3. Use the cursor to move ve data points from the bowl to the following points (x,y) on the graph: ('59'2) (1'1) (2'7) (335) (598) 4. Click on the \"Curve\" checkbox to diSplay the \"best t\" line. 5.Click on the \"Residuals\" and \"Values\" checkboxes. You may nd that the values are not exactly what you expect adjust the values if needed. 6. Write the equation of the best t line, the sum of squared errors (X2) value, and the coefcient of determination (1'?) value. 7. Click on the \"Quadratic\" checkbox. 8. Write the resulting equation and the X2 and 1'2 values. 9. Click on the \"Cubic\" checkbox. 10. Write the resulting equation and the X2 and f values. 11. With your cursor, move the blue error bars associated with several points up and down and see What happens. The remaining steps are optional and worth up to two points of extra credit. 12. Open either Excel or Google Sheets. 13. Write the data values in data table. 14. Perform the regression analysis using the Analysis ToolPak in Excel or similar tool in Google Sheets. 15. Copy the results into this or another Word document that I can View without having to open Excel or Google Sheets
Step by Step Solution
There are 3 Steps involved in it

Get step-by-step solutions from verified subject matter experts