

Question: Physic C 1-2 These are instructions for graphing with Excel 2007 and 2010 Instructions for graphing with Excel. Format the array into a table with
Physic C 1-2 These are instructions for graphing with Excel 2007 and 2010
Instructions for graphing with Excel.
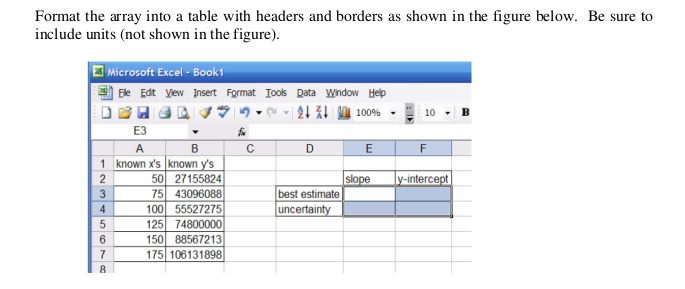
Format the array into a table with headers and borders as shown in the figure below. Be sure to include units (not shown in the figure). B Es Microsoft Excel - Book1 Ele Edt Vew Insert Format Tools Data Window Help 21% 100% 10. B E3 B D E F 1 known X's known y's 2 50 27155824 slope ly-intercept 3 75 43096088 best estimate 4 100 55527275 uncertainty 5 125 74800000 6 150 88567213 7 175 106131898 8 Format the array into a table with headers and borders as shown in the figure below. Be sure to include units (not shown in the figure). B Es Microsoft Excel - Book1 Ele Edt Vew Insert Format Tools Data Window Help 21% 100% 10. B E3 B D E F 1 known X's known y's 2 50 27155824 slope ly-intercept 3 75 43096088 best estimate 4 100 55527275 uncertainty 5 125 74800000 6 150 88567213 7 175 106131898 8
Step by Step Solution
There are 3 Steps involved in it

Get step-by-step solutions from verified subject matter experts