

Question: PHYSICS 211 3. You wish to plot the function y = Ae where the amplitude A=25. Make a sketch of this graph in the box
PHYSICS 211
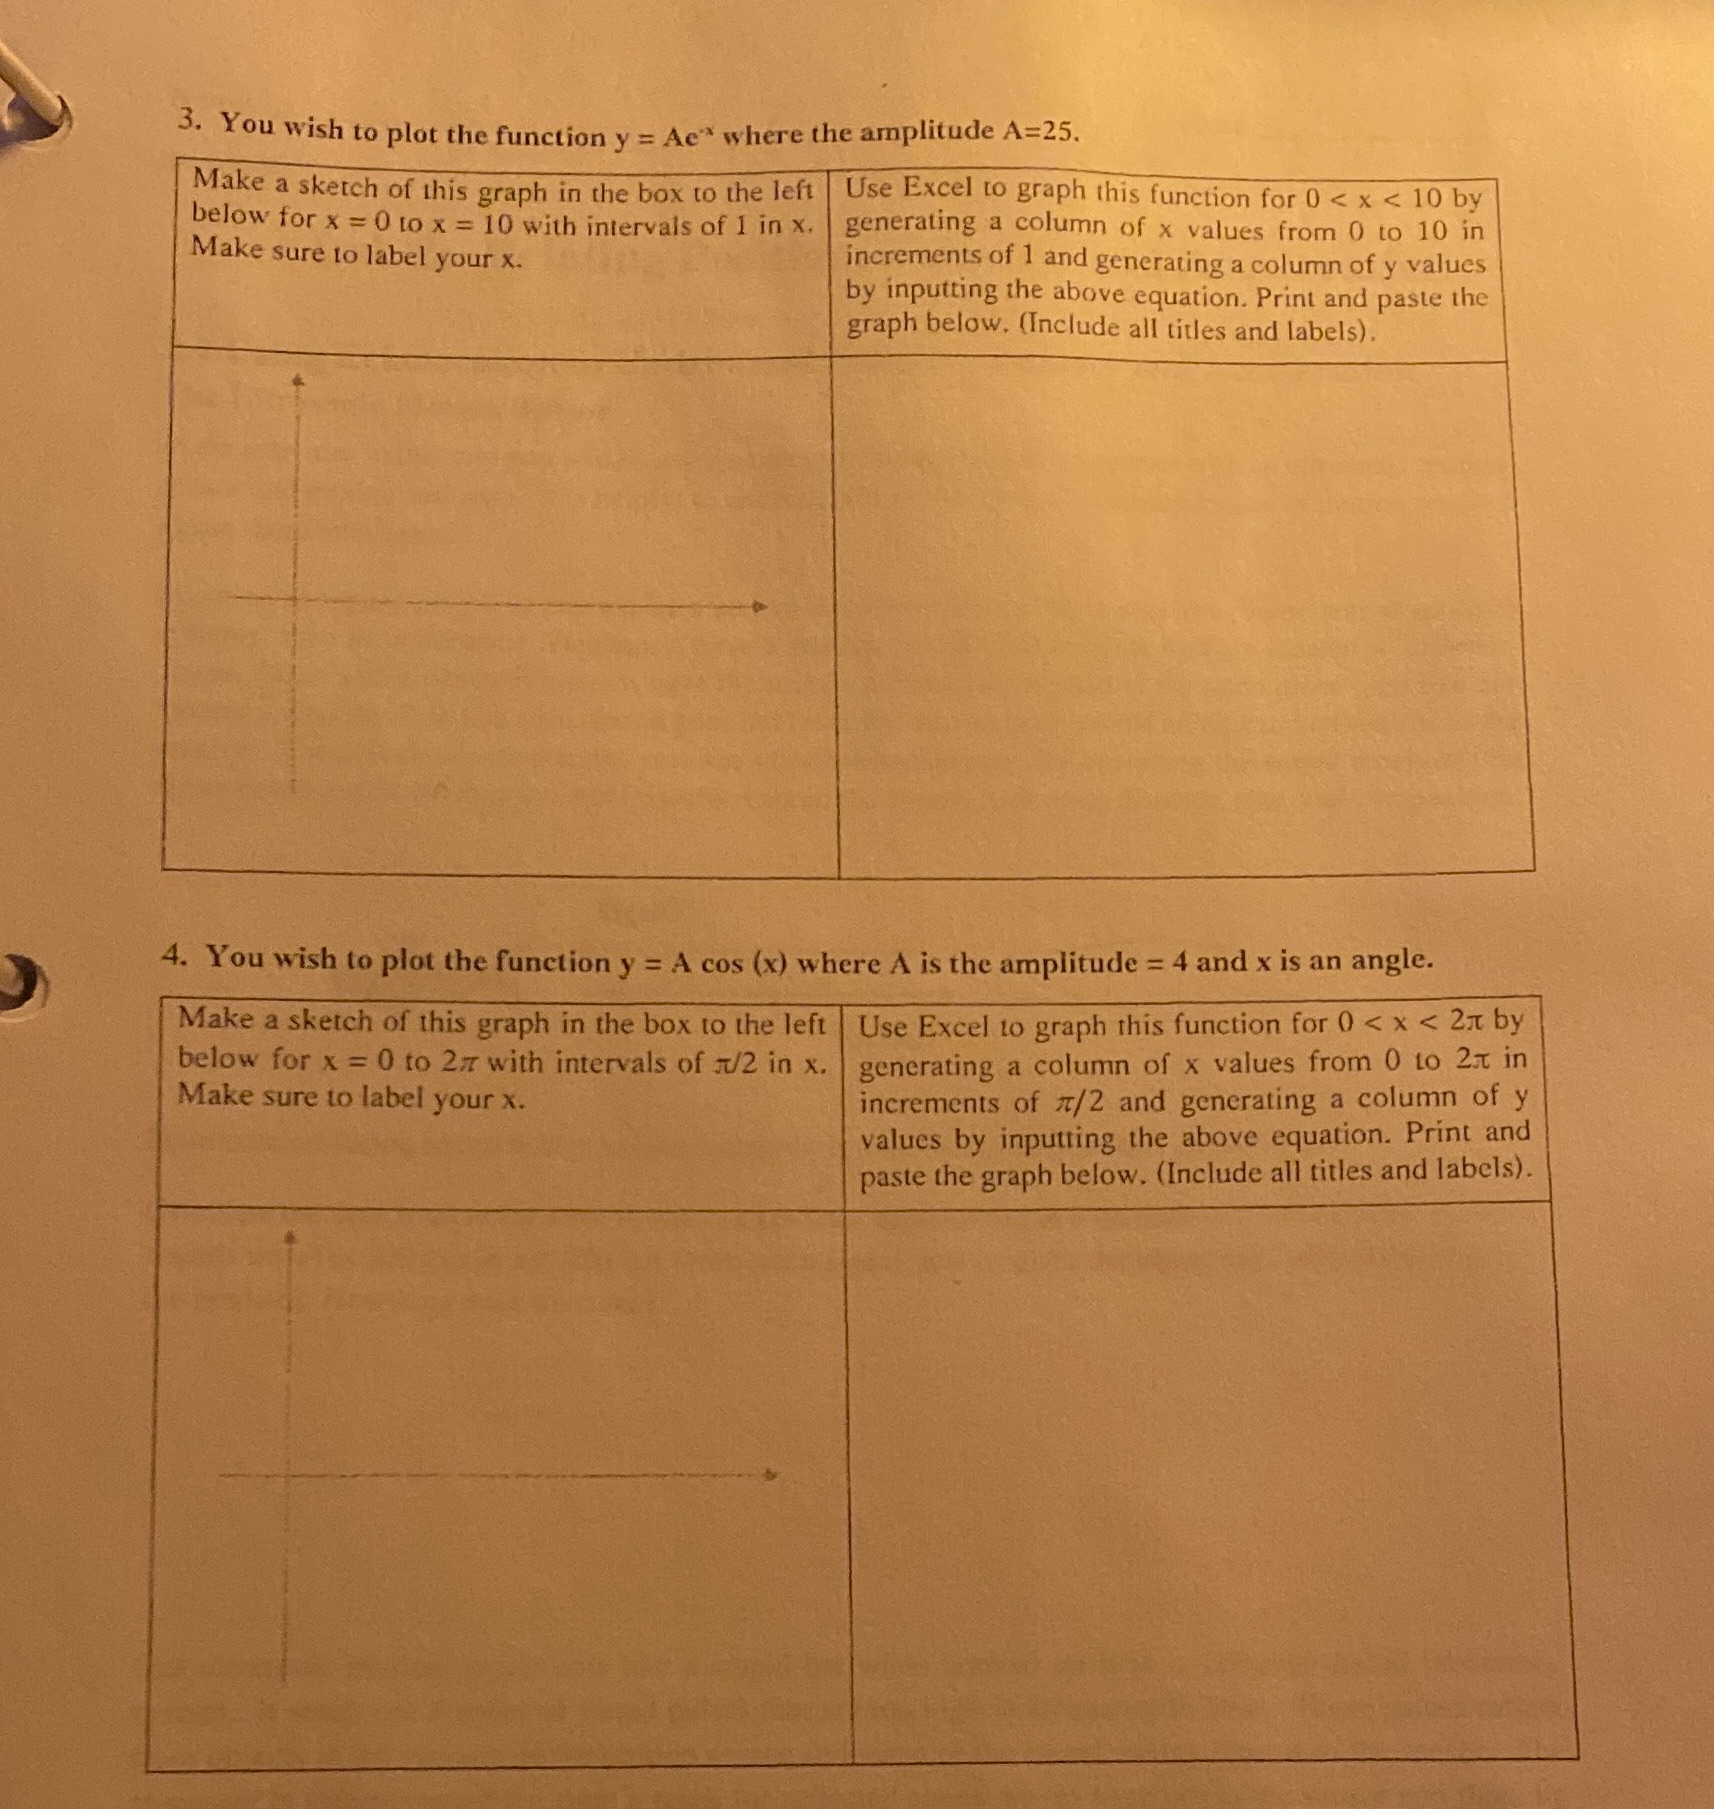
3. You wish to plot the function y = Ae" where the amplitude A=25. Make a sketch of this graph in the box to the left | Use Excel to graph this function for 0
Step by Step Solution
There are 3 Steps involved in it
1 Expert Approved Answer
Step: 1 Unlock

Question Has Been Solved by an Expert!
Get step-by-step solutions from verified subject matter experts
Step: 2 Unlock
Step: 3 Unlock