

Question: Physics The following graph plots the position versus time (x-t) graph for an object moving along the x-axis. Rank the velocity at points A-C. X
Physics
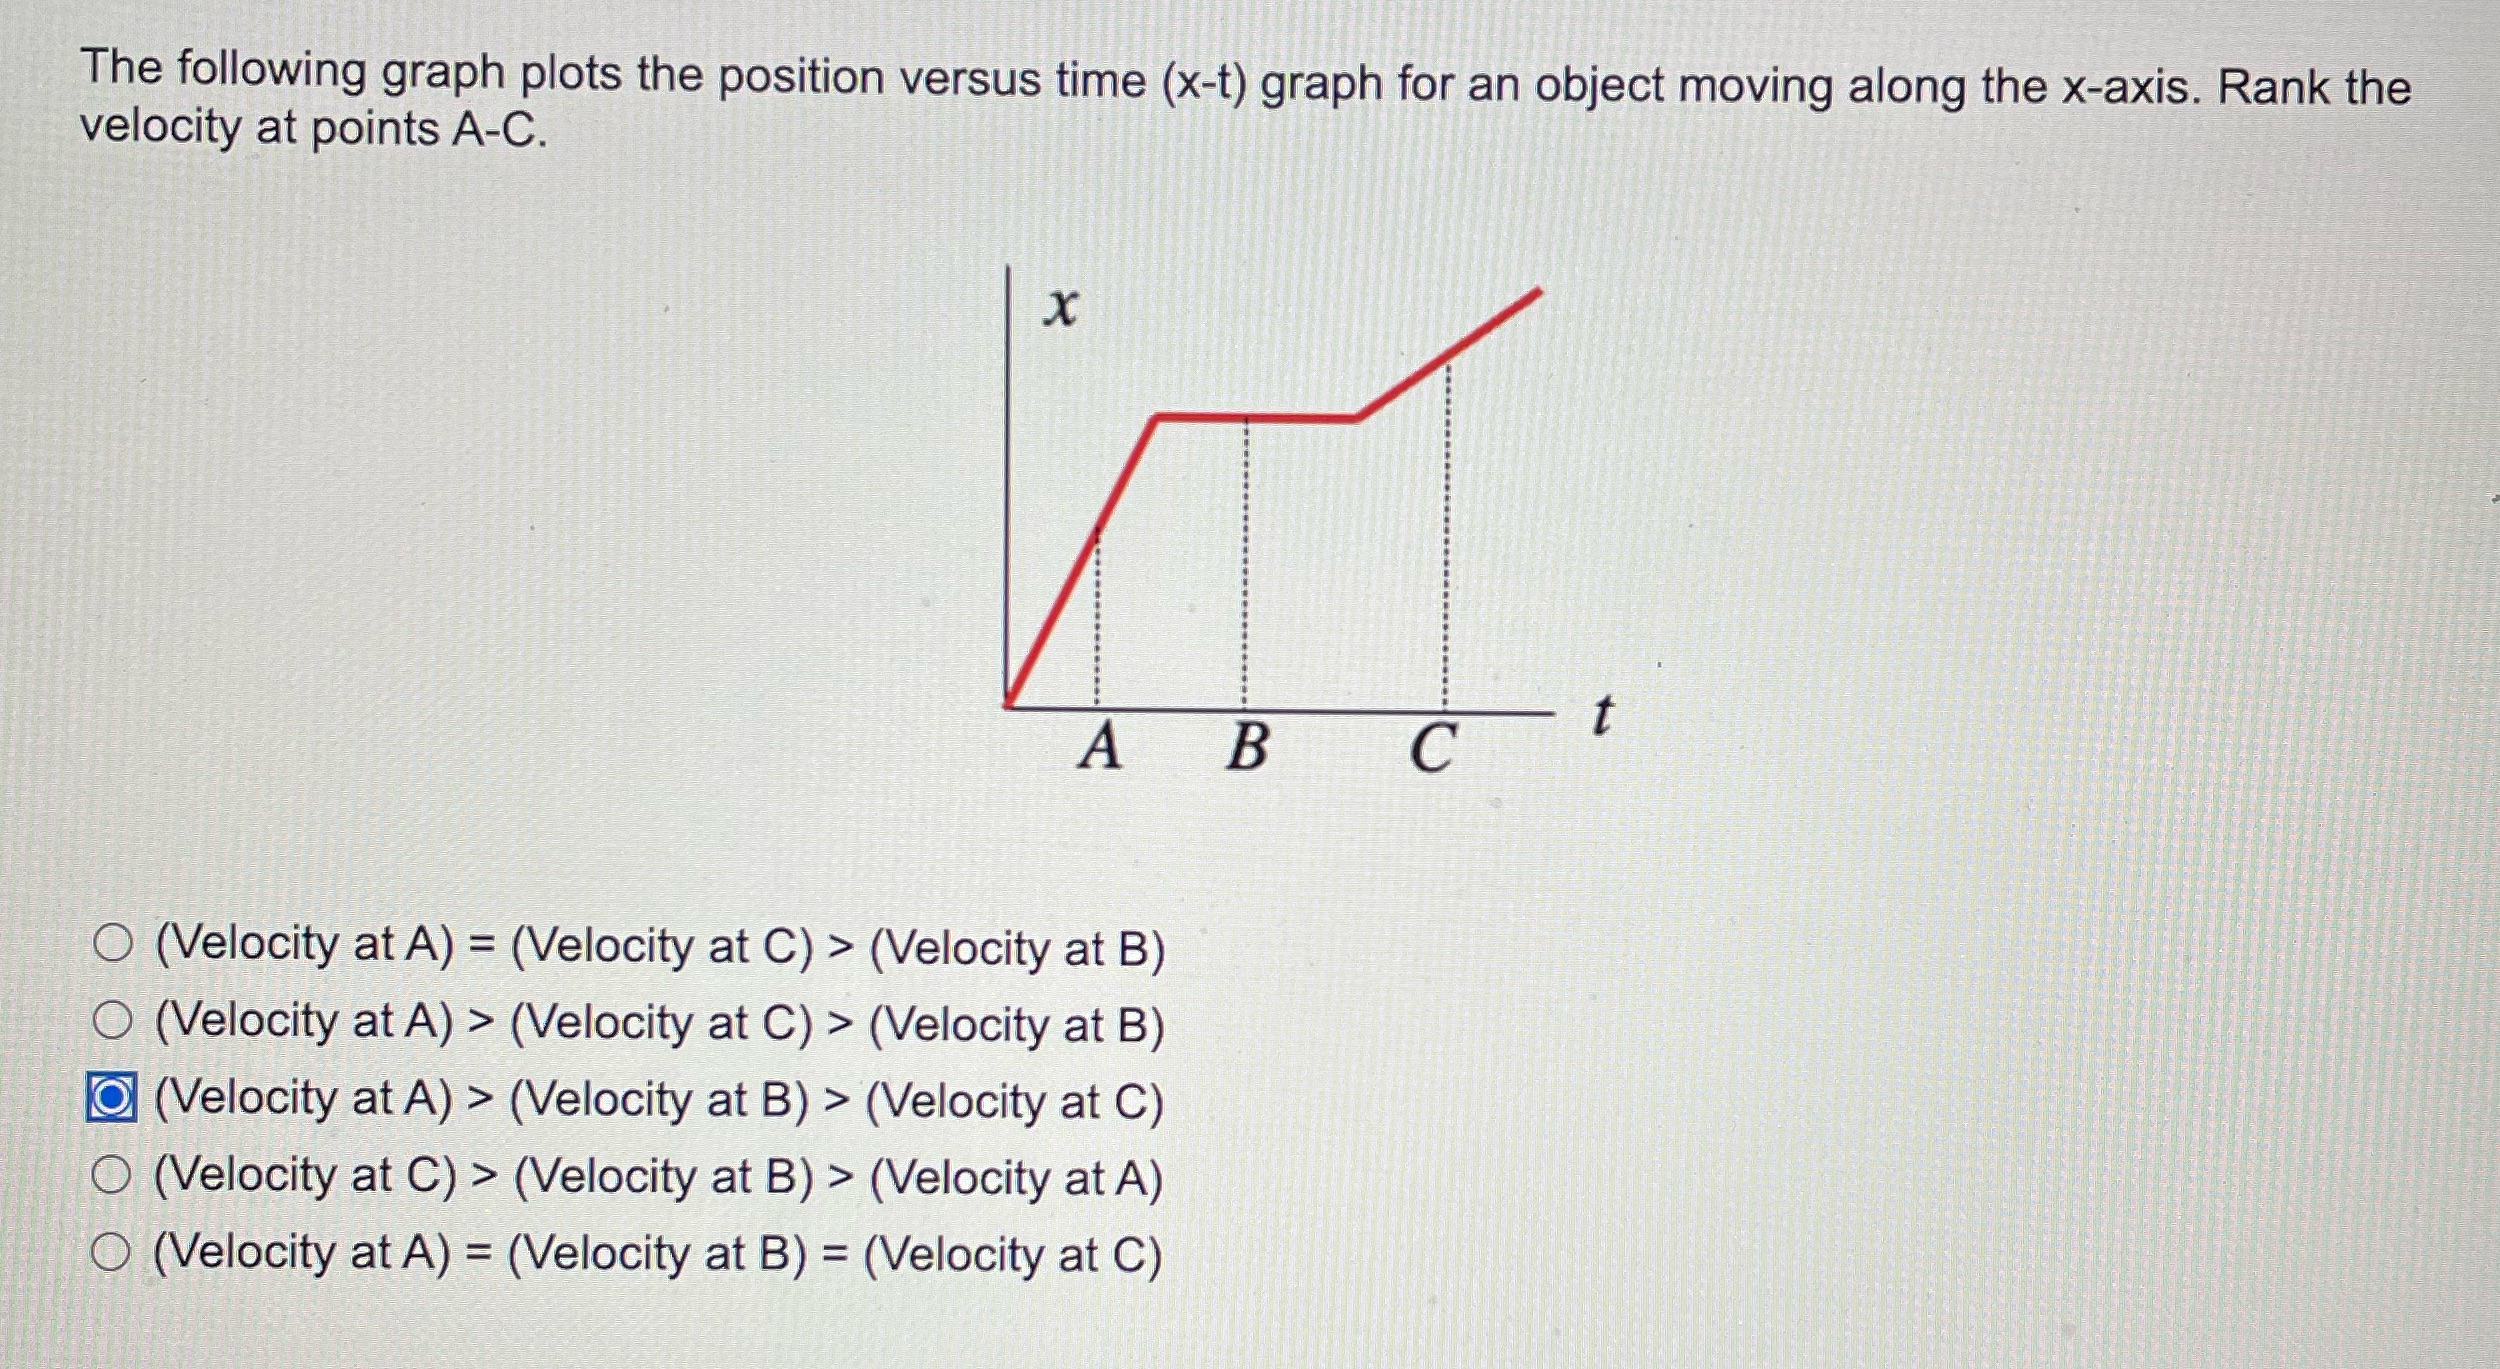
The following graph plots the position versus time (x-t) graph for an object moving along the x-axis. Rank the velocity at points A-C. X A B C O (Velocity at A) = (Velocity at C) > (Velocity at B) O (Velocity at A) > (Velocity at C) > (Velocity at B) (Velocity at A) > (Velocity at B) > (Velocity at C) O (Velocity at C) > (Velocity at B) > (Velocity at A) O (Velocity at A) = (Velocity at B) = (Velocity at C)
Step by Step Solution
There are 3 Steps involved in it
1 Expert Approved Answer
Step: 1 Unlock

Question Has Been Solved by an Expert!
Get step-by-step solutions from verified subject matter experts
Step: 2 Unlock
Step: 3 Unlock