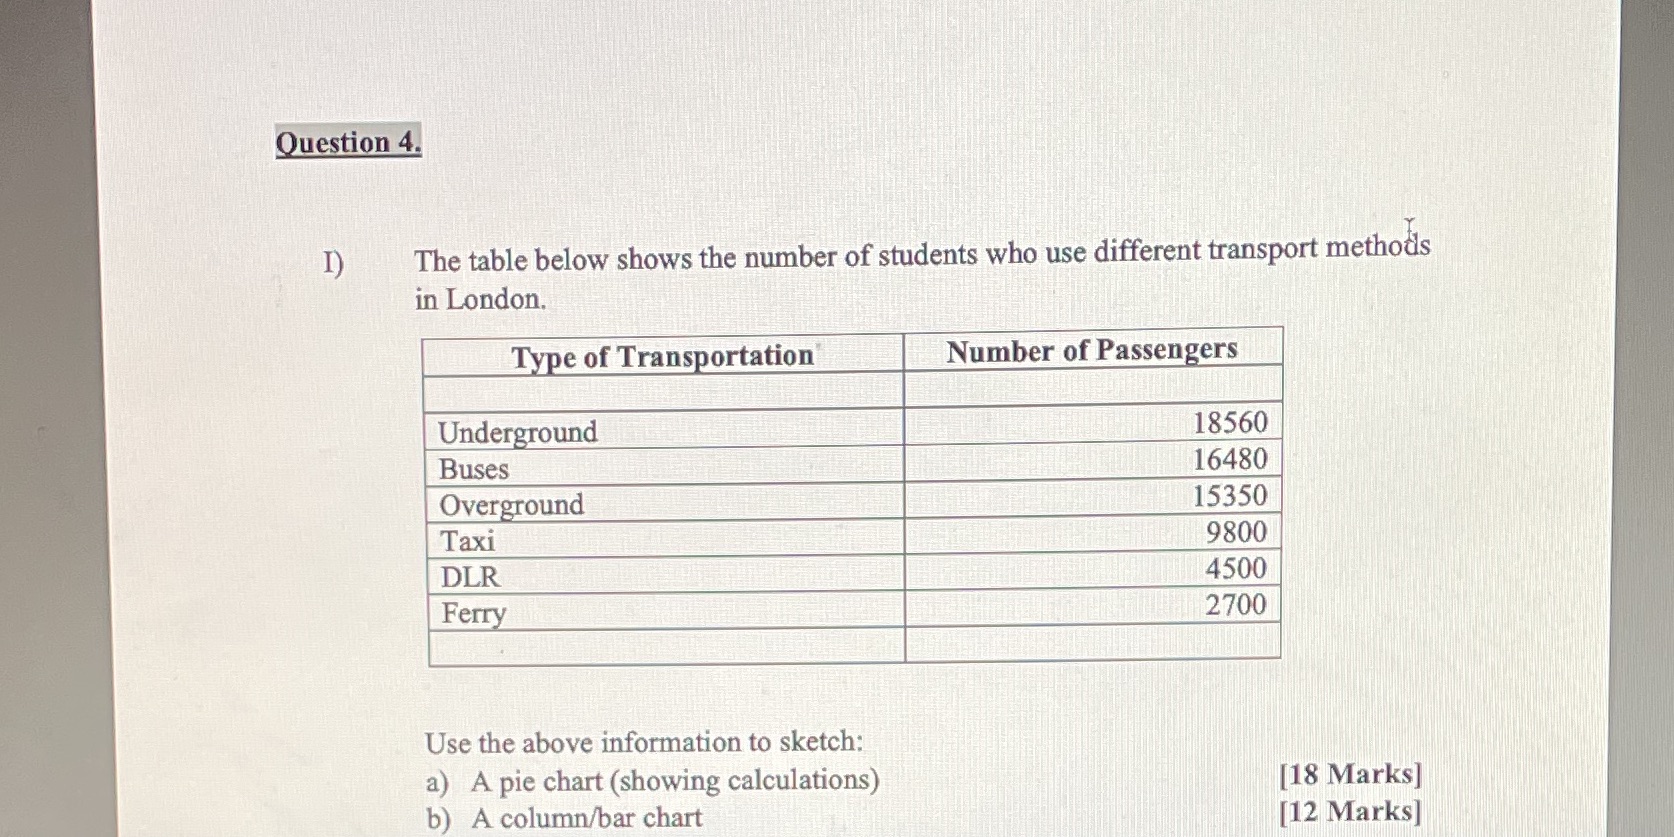
Question: Pie chart or bar chart to sketch information in table Question 4. The table below shows the number of students who use different transport methods

Pie chart or bar chart to sketch information in table

Pie chart or bar chart to sketch information in
Question 4. The table below shows the number of students who use different transport methods in London. Type of Transportation Number of Passengers Underground 18560 Buses 16480 Overground 15350 Taxi 9800 DLR 4500 Ferry 2700 Use the above information to sketch: a) A pie chart (showing calculations) [18 Marks] b) A column/bar chart [12 Marks]

Step by Step Solution

There are 3 Steps involved in it

1 Expert Approved Answer
Step: 1 Unlock blur-text-image
Question Has Been Solved by an Expert!

Get step-by-step solutions from verified subject matter experts

Step: 2 Unlock
Step: 3 Unlock

Students Have Also Explored These Related Mathematics Questions!