

Question: plan it am 3 25. O B Spreadsheet 26. O A major automobile manufacturer located in Georgetown, Kentucky, has two certified vendors that produce brake
plan it
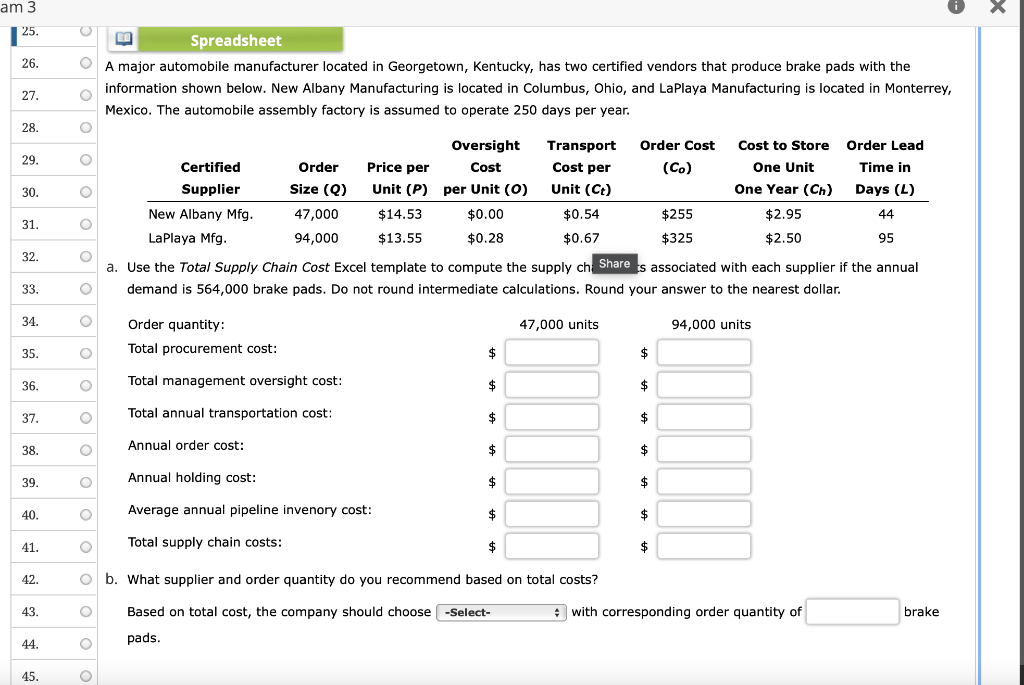
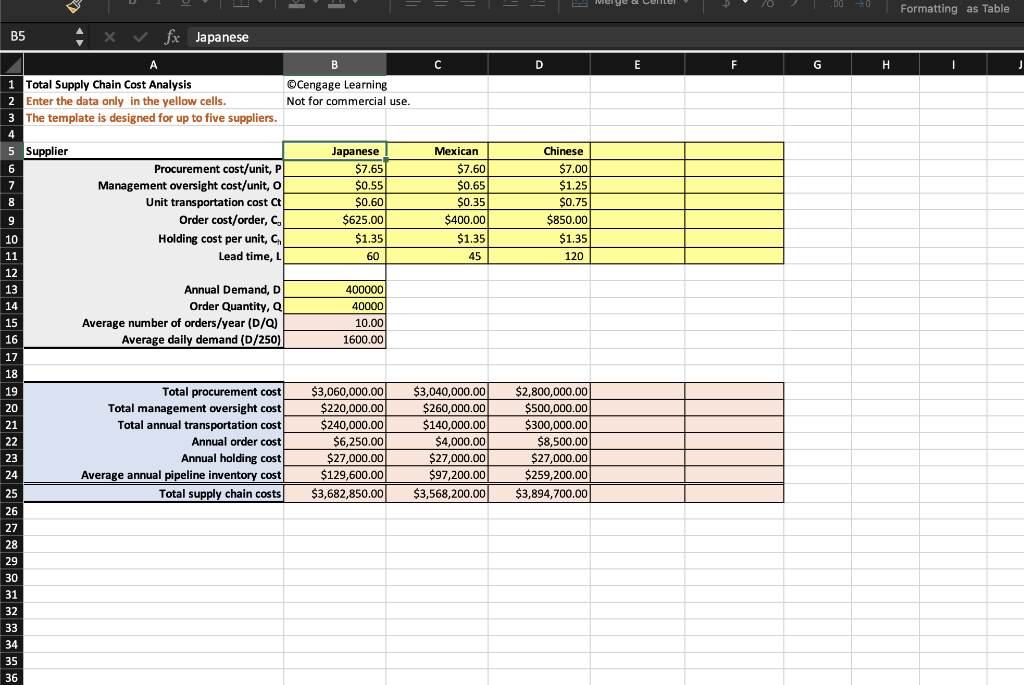
am 3 25. O B Spreadsheet 26. O A major automobile manufacturer located in Georgetown, Kentucky, has two certified vendors that produce brake pads with the information shown below. New Albany Manufacturing is located in Columbus, Ohio, and LaPlaya Manufacturing is located in Monterrey, O Mexico. The automobile assembly factory is assumed to operate 250 days per year. 27. 28. O Oversight Cost Transport Cost per Order Cost (Co) Cost to Store One Unit Order Lead Time in 29. O Certified Supplier Order Size (Q) Price per Unit (P) Unit (Ct) per Unit (0) One Year (Ch) 30. Days (L) O New Albany Mfg. 47,000 $14.53 $0.00 $0.54 $255 $2.95 44 31. O LaPlaya Mfg. 94,000 $13.55 $0.28 $0.67 $325 $2.50 95 32. O a. Use the Total Supply Chain Cost Excel template to compute the supply cha Shares associated with each supplier if the annual demand is 564,000 brake pads. Do not round intermediate calculations. Round your answer to the nearest dollar. 33. O 34. O Order quantity: 47,000 units 94,000 units Total procurement cost: 35. O $ $ 36. O Total management oversight cost: $ $ 37. O Total annual transportation cost: $ $ Annual order cost: 38. O $ $ Annual holding cost: 39. O $ $ 40. O Average annual pipeline invenory cost: $ $ 41. O Total supply chain costs: $ $ 42. O b. What supplier and order quantity do you recommend based on total costs? 43. brake O Based on total cost, the company should choose -Select- with corresponding order quantity of pads. 44. O 45. O B5 X A 1 Total Supply Chain Cost Analysis 2 Enter the data only in the yellow cells. 3 The template is designed for up to five suppliers. 4 Supplier Procurement cost/unit, P Management oversight cost/unit, o Unit transportation cost Ct Order cost/order, C. Holding cost per unit, C Lead time, L Annual Demand, D Order Quantity, Q Average number of orders/year (D/Q) Average daily demand (D/250) Total procurement cost Total management oversight cost Total annual transportation cost Annual order cost Annual holding cost Average annual pipeline inventory cost Total supply chain costs 5 6 7 8 fx Japanese 9 10 11 12 13 14 15 16 17 18 19 20 21 22 23 24 25 26 27 28 29 30 31 32 33 34 35 36 B Cengage Learning Not for commercial use. Japanese $7.65 $0.55 $0.60 $625.00 $1.35 60 400000 40000 10.00 1600.00 $3,060,000.00 $220,000.00 $240,000.00 $6,250.00 $27,000.00 $129,600.00 $3,682,850.00 Mexican $7.60 $0.65 $0.35 $400.00 $1.35 45 $3,040,000.00 $260,000.00 $140,000.00 $4,000.00 $27,000.00 $97,200.00 $3,568,200.00 D Chinese $7.00 $1.25 $0.75 $850.00 $1.35 120 $2,800,000.00 $500,000.00 $300,000.00 $8,500.00 $27,000.00 $259,200.00 $3,894,700.00 E F G .00 -0 H Formatting as Table I am 3 25. O B Spreadsheet 26. O A major automobile manufacturer located in Georgetown, Kentucky, has two certified vendors that produce brake pads with the information shown below. New Albany Manufacturing is located in Columbus, Ohio, and LaPlaya Manufacturing is located in Monterrey, O Mexico. The automobile assembly factory is assumed to operate 250 days per year. 27. 28. O Oversight Cost Transport Cost per Order Cost (Co) Cost to Store One Unit Order Lead Time in 29. O Certified Supplier Order Size (Q) Price per Unit (P) Unit (Ct) per Unit (0) One Year (Ch) 30. Days (L) O New Albany Mfg. 47,000 $14.53 $0.00 $0.54 $255 $2.95 44 31. O LaPlaya Mfg. 94,000 $13.55 $0.28 $0.67 $325 $2.50 95 32. O a. Use the Total Supply Chain Cost Excel template to compute the supply cha Shares associated with each supplier if the annual demand is 564,000 brake pads. Do not round intermediate calculations. Round your answer to the nearest dollar. 33. O 34. O Order quantity: 47,000 units 94,000 units Total procurement cost: 35. O $ $ 36. O Total management oversight cost: $ $ 37. O Total annual transportation cost: $ $ Annual order cost: 38. O $ $ Annual holding cost: 39. O $ $ 40. O Average annual pipeline invenory cost: $ $ 41. O Total supply chain costs: $ $ 42. O b. What supplier and order quantity do you recommend based on total costs? 43. brake O Based on total cost, the company should choose -Select- with corresponding order quantity of pads. 44. O 45. O B5 X A 1 Total Supply Chain Cost Analysis 2 Enter the data only in the yellow cells. 3 The template is designed for up to five suppliers. 4 Supplier Procurement cost/unit, P Management oversight cost/unit, o Unit transportation cost Ct Order cost/order, C. Holding cost per unit, C Lead time, L Annual Demand, D Order Quantity, Q Average number of orders/year (D/Q) Average daily demand (D/250) Total procurement cost Total management oversight cost Total annual transportation cost Annual order cost Annual holding cost Average annual pipeline inventory cost Total supply chain costs 5 6 7 8 fx Japanese 9 10 11 12 13 14 15 16 17 18 19 20 21 22 23 24 25 26 27 28 29 30 31 32 33 34 35 36 B Cengage Learning Not for commercial use. Japanese $7.65 $0.55 $0.60 $625.00 $1.35 60 400000 40000 10.00 1600.00 $3,060,000.00 $220,000.00 $240,000.00 $6,250.00 $27,000.00 $129,600.00 $3,682,850.00 Mexican $7.60 $0.65 $0.35 $400.00 $1.35 45 $3,040,000.00 $260,000.00 $140,000.00 $4,000.00 $27,000.00 $97,200.00 $3,568,200.00 D Chinese $7.00 $1.25 $0.75 $850.00 $1.35 120 $2,800,000.00 $500,000.00 $300,000.00 $8,500.00 $27,000.00 $259,200.00 $3,894,700.00 E F G .00 -0 H Formatting as TableStep by Step Solution
There are 3 Steps involved in it
1 Expert Approved Answer
Step: 1 Unlock

Question Has Been Solved by an Expert!
Get step-by-step solutions from verified subject matter experts
Step: 2 Unlock
Step: 3 Unlock