

Question: PLE embarked on a four-year quality improvement program at the end of 2014 to reduce the company's number of defects.Use hypothesis testing and the sample
PLE embarked on a four-year quality improvement program at the end of 2014 to reduce the company's number of defects.Use hypothesis testing and the sample data in theDefects After Deliveryworksheet to determine if the quality improvement program was effective.Assume a significance level of 0.05.Add a data visualization to illustrate any trend in the average number of defects over time.Briefly describe the solution technique and provide brief explanation of the analysis in a way that management can easily understand.
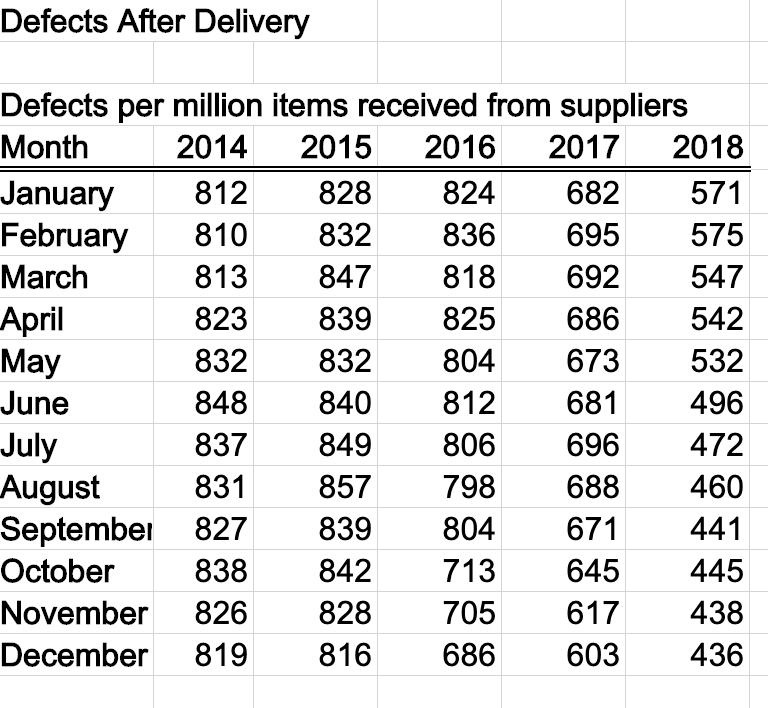
Defects After Delivery Defects per million items received from suppliers Month 2014 2015 2016 2017 2018 January 812 828 824 682 571 February 810 832 836 695 575 March 813 847 818 692 547 April 823 839 825 686 542 May 832 832 804 673 532 June 848 840 812 681 496 July 837 849 806 696 472 August 831 857 798 688 460 September 827 839 804 671 441 October 838 842 713 645 445 November 826 828 705 617 438 December 819 816 686 603 436
Step by Step Solution
There are 3 Steps involved in it

Get step-by-step solutions from verified subject matter experts