

Question: pleas I don't want take the answer from old answer in chegg , becuse there is no answer for problem#4, and i think the answer
pleas I don't want take the answer from old answer in chegg , becuse there is no answer for problem#4, and i think the answer in chegg not right . i want to do it in MATLAB 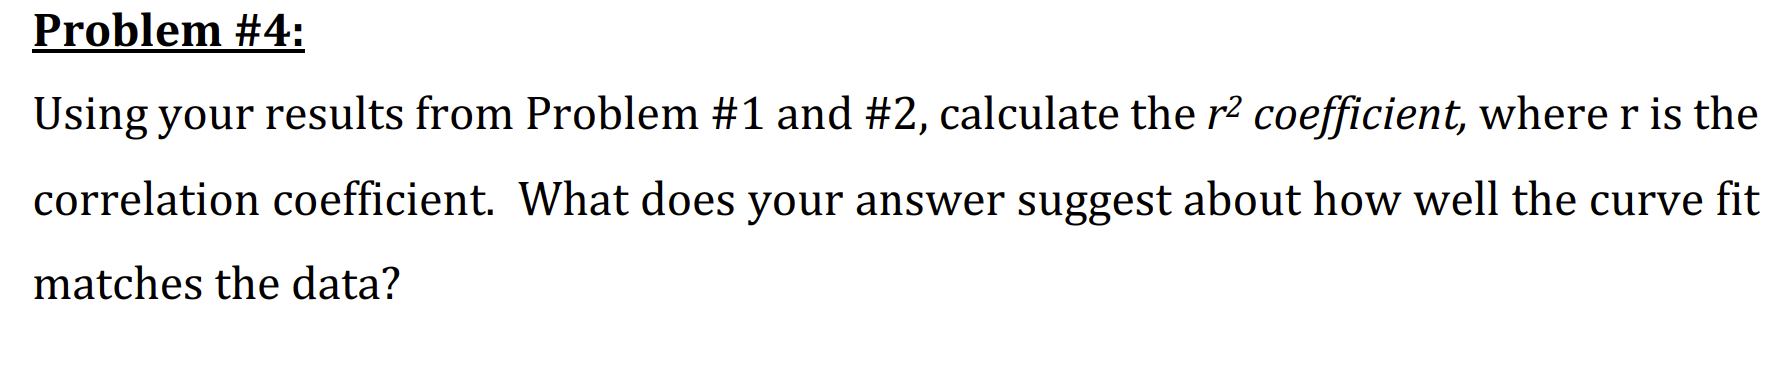
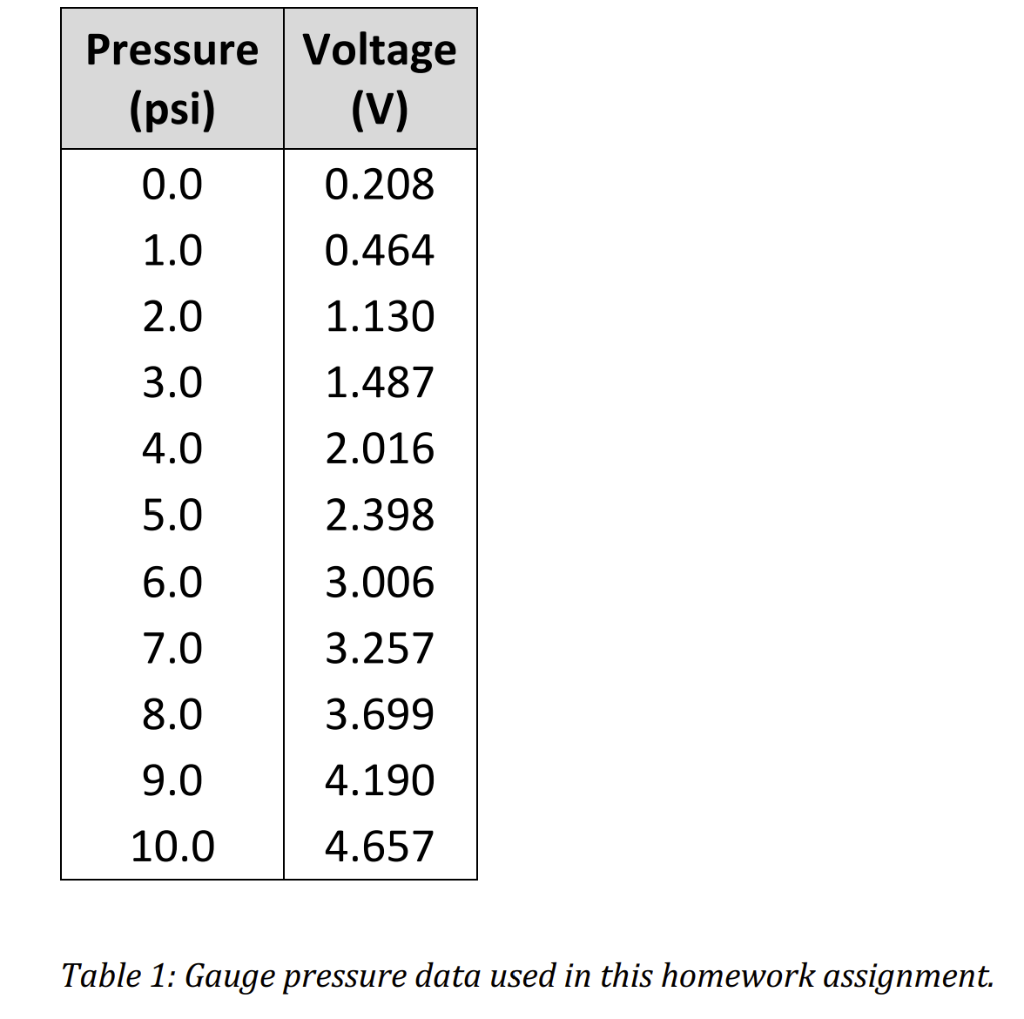
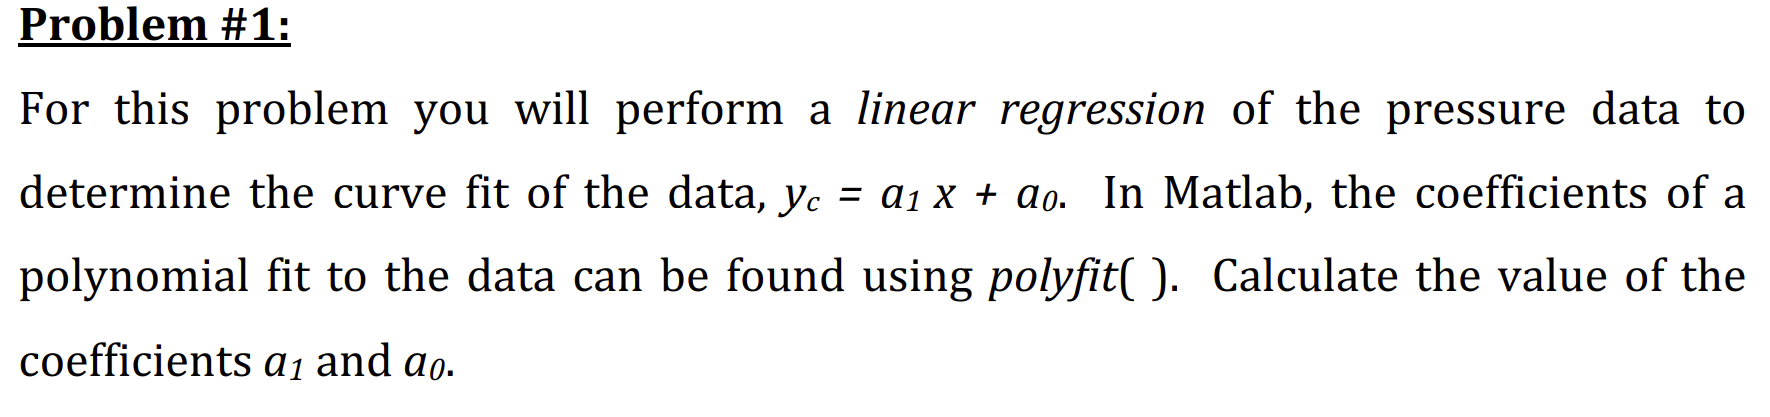
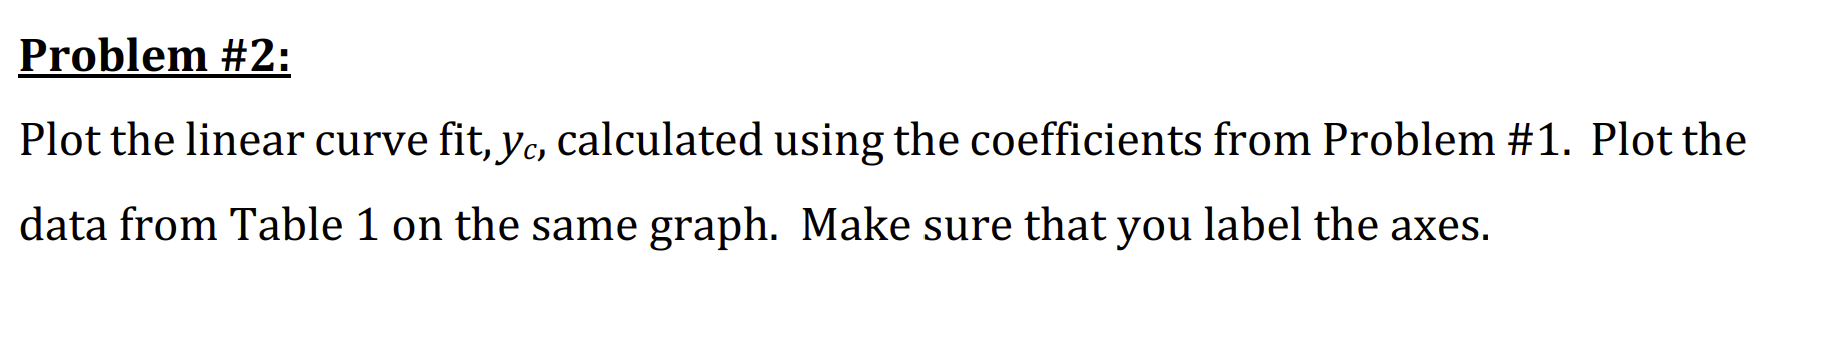
Problem #4: Using your results from Problem #1 and #2, calculate the r2 coefficient, where r is the correlation coefficient. What does your answer suggest about how well the curve fit matches the data? Pressure Voltage (psi) (V) 0.0 0.208 1.0 0.464 2.0 1.130 3.0 1.487 4.0 2.016 2.398 5.0 6.0 3.006 7.0 3.257 8.0 3.699 9.0 4.190 10.0 4.657 Table 1: Gauge pressure data used in this homework assignment. Problem #1: For this problem you will perform a linear regression of the pressure data to determine the curve fit of the data, yo = ai x + do. In Matlab, the coefficients of a yc a polynomial fit to the data can be found using polyfit( ). Calculate the value of the coefficients ay and do. Problem #2: Plot the linear curve fit, yc, calculated using the coefficients from Problem #1. Plot the data from Table 1 on the same graph. Make sure that you label the axes. Problem #3: Using your results from Problem #1 and #2, calculate the standard error of the fit, Syx. What are the units of Syx in this case? Problem #4: Using your results from Problem #1 and #2, calculate the r2 coefficient, where r is the correlation coefficient. What does your answer suggest about how well the curve fit matches the data? Pressure Voltage (psi) (V) 0.0 0.208 1.0 0.464 2.0 1.130 3.0 1.487 4.0 2.016 2.398 5.0 6.0 3.006 7.0 3.257 8.0 3.699 9.0 4.190 10.0 4.657 Table 1: Gauge pressure data used in this homework assignment. Problem #1: For this problem you will perform a linear regression of the pressure data to determine the curve fit of the data, yo = ai x + do. In Matlab, the coefficients of a yc a polynomial fit to the data can be found using polyfit( ). Calculate the value of the coefficients ay and do. Problem #2: Plot the linear curve fit, yc, calculated using the coefficients from Problem #1. Plot the data from Table 1 on the same graph. Make sure that you label the axes. Problem #3: Using your results from Problem #1 and #2, calculate the standard error of the fit, Syx. What are the units of Syx in this case
Step by Step Solution
There are 3 Steps involved in it

Get step-by-step solutions from verified subject matter experts