

Question: please add captured excel sheet each value for each service value represntibg each tgere is a clear picture show how excel sheet should be .
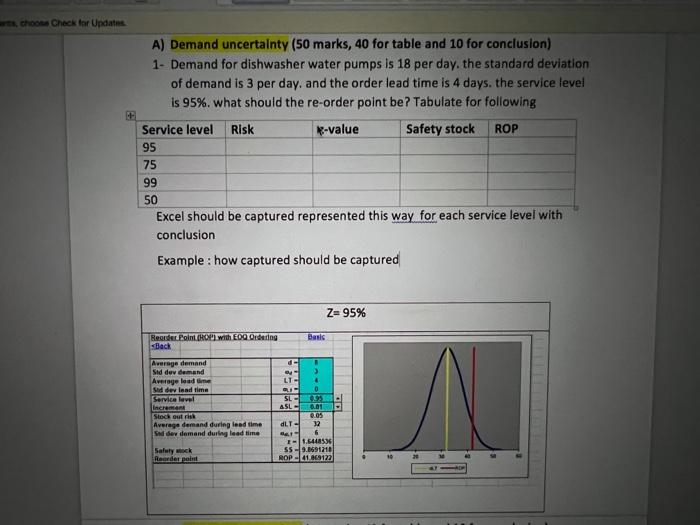
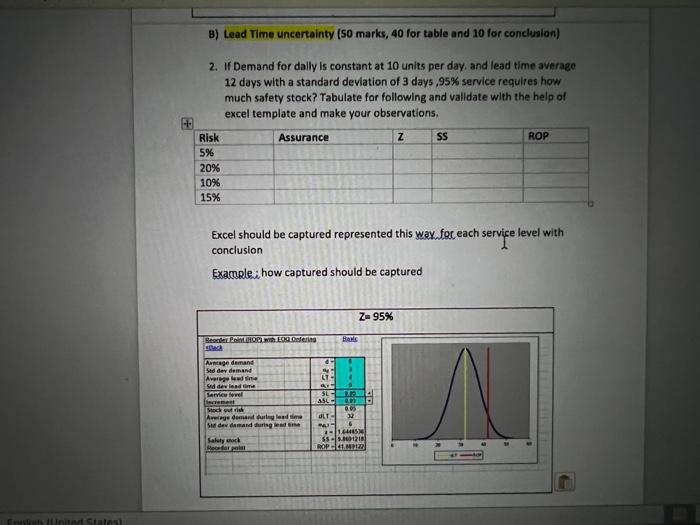
A) Demand uncertainty ( 50 marks, 40 for table and 10 for conclusion) 1- Demand for dishwasher water pumps is 18 per day, the standard deviation of demand is 3 per day. and the order lead time is 4 days. the service level is 95%. what should the re-order point be? Tabulate for following Excel should be captured represented this way for each service level with conclusion Example : how captured should be captured 8) Lead Time uncertainty ( 50 marks, 40 for table and 10 for conclusion) 2. If Demand for dally is constant at 10 units per day, and lead time average 12 days with a standard deviation of 3 days, 95% service requires how much safety stock? Tabulate for following and validate with the help of excel template and make your observations. Excel should be captured represented this way foc each servife level with conclusion Example; how captured should be captured
Step by Step Solution
There are 3 Steps involved in it

Get step-by-step solutions from verified subject matter experts