

Question: Please also show the graph change The following graph represents market for British pounds (). The supply curve for pounds is represented by the orange
Please also show the graph change
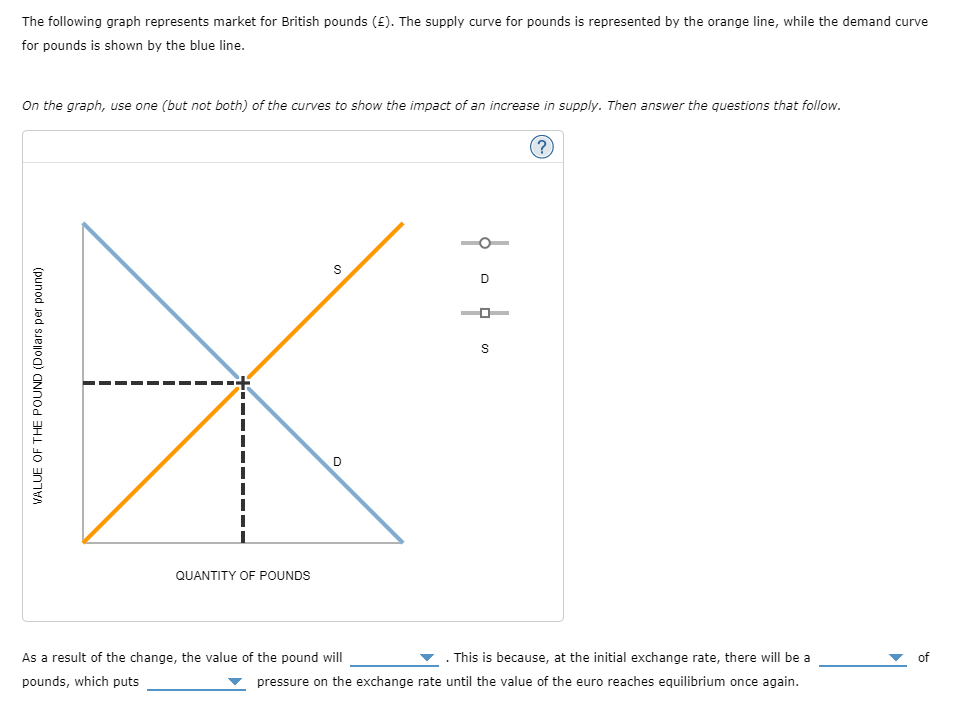
The following graph represents market for British pounds (). The supply curve for pounds is represented by the orange line, while the demand curve for pounds is shown by the blue line. On the graph, use one (but not both) of the curves to show the impact of an increase in supply. Then answer the questions that follow. S . . VALUE OF THE POUND (Dollars per pound) D QUANTITY OF POUNDS of As a result of the change, the value of the pound will This is because, at the initial exchange rate, there will be a pounds, which puts pressure on the exchange rate until the value of the euro reaches equilibrium once again
Step by Step Solution
There are 3 Steps involved in it

Get step-by-step solutions from verified subject matter experts