

Question: please Analyse the tables below Hausman Test Correlated Random Effects - Hausman Test Equation: Untitled Test cross-section random effects Test Summary Chi-Sq. Statistic Chi-Sq. d.f.
please Analyse the tables below
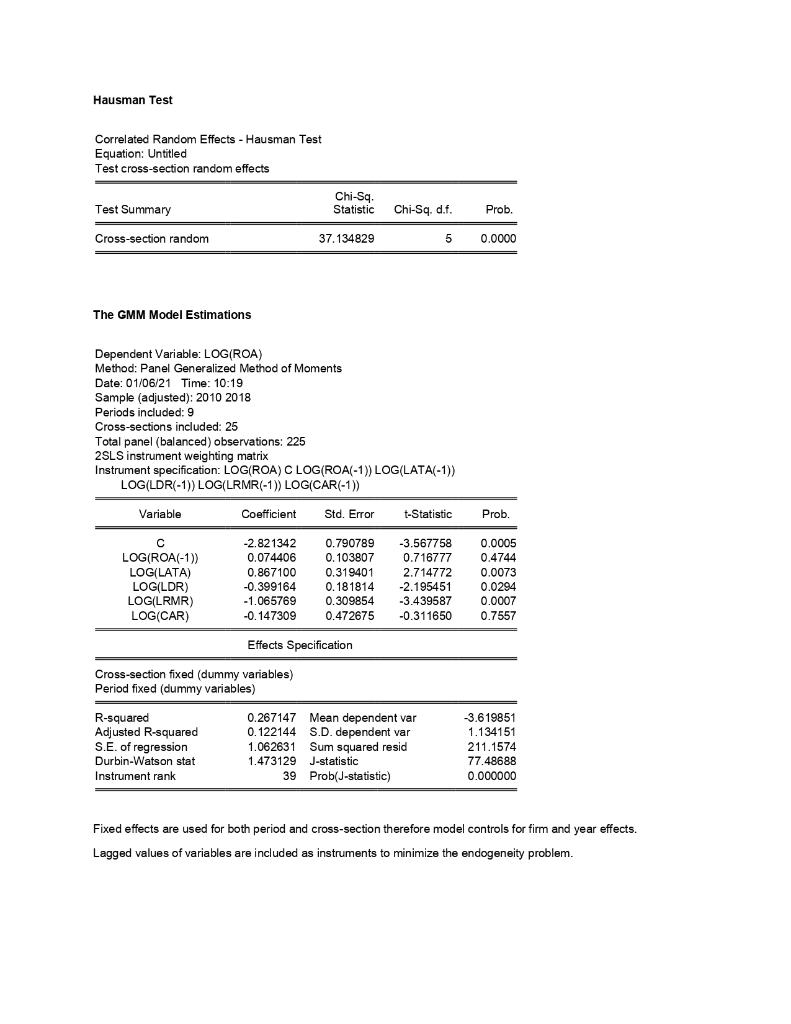
Hausman Test Correlated Random Effects - Hausman Test Equation: Untitled Test cross-section random effects Test Summary Chi-Sq. Statistic Chi-Sq. d.f. Prob. Cross-section random - 37.134829 5 0.0000 The GMM Model Estimations Dependent Variable: LOG(ROA) Method: Panel Generalized Method of Moments Date: 01/06/21 Time: 10:19 Sample (adjusted): 2010 2018 Periods included: 9 Cross-sections included: 25 Total panel (balanced) observations: 225 2SLS instrument weighting matrix Instrument specification: LOG(ROA) C LOG(ROA(-1)) LOG(LATA(-1)) LOG(LDR(-1)) LOG(LRMR(-1)) LOG(CAR(-1)) Variable Coefficient Std. Error t-Statistic Prob. LOG(ROA(-1)) LOG(LATA) LOG(LDR) LOG(LRMR) LOG(CAR) ( -2.821342 0.074406 0.867100 -0.399164 -1.065769 -0.147309 0.790789 0.103807 0.319401 0.181814 0.309854 0.472675 -3.567758 0.716777 2.714772 -2.195451 -3.439587 -0.311650 0.0005 0.4744 0.0073 0.0294 0.0007 0.7557 Effects Specification Cross-section fixed (dummy variables) Period fixed (dummy variables) R-squared Adjusted R-squared S.E. of regression Durbin-Watson stat Instrument rank 0.267147 Mean dependent var 0.122144 S.D. dependent var 1.062631 Sum squared resid 1.473129 J-statistic 39 Prob(J-statistic) -3.6 19851 1.134151 211.1574 77.48688 0.000000 Fixed effects are used for both period and cross-section therefore model controls for firm and year effects. Lagged values of variables are included as instruments to minimize the endogeneity problem. Hausman Test Correlated Random Effects - Hausman Test Equation: Untitled Test cross-section random effects Test Summary Chi-Sq. Statistic Chi-Sq. d.f. Prob. Cross-section random - 37.134829 5 0.0000 The GMM Model Estimations Dependent Variable: LOG(ROA) Method: Panel Generalized Method of Moments Date: 01/06/21 Time: 10:19 Sample (adjusted): 2010 2018 Periods included: 9 Cross-sections included: 25 Total panel (balanced) observations: 225 2SLS instrument weighting matrix Instrument specification: LOG(ROA) C LOG(ROA(-1)) LOG(LATA(-1)) LOG(LDR(-1)) LOG(LRMR(-1)) LOG(CAR(-1)) Variable Coefficient Std. Error t-Statistic Prob. LOG(ROA(-1)) LOG(LATA) LOG(LDR) LOG(LRMR) LOG(CAR) ( -2.821342 0.074406 0.867100 -0.399164 -1.065769 -0.147309 0.790789 0.103807 0.319401 0.181814 0.309854 0.472675 -3.567758 0.716777 2.714772 -2.195451 -3.439587 -0.311650 0.0005 0.4744 0.0073 0.0294 0.0007 0.7557 Effects Specification Cross-section fixed (dummy variables) Period fixed (dummy variables) R-squared Adjusted R-squared S.E. of regression Durbin-Watson stat Instrument rank 0.267147 Mean dependent var 0.122144 S.D. dependent var 1.062631 Sum squared resid 1.473129 J-statistic 39 Prob(J-statistic) -3.6 19851 1.134151 211.1574 77.48688 0.000000 Fixed effects are used for both period and cross-section therefore model controls for firm and year effects. Lagged values of variables are included as instruments to minimize the endogeneity
Step by Step Solution
There are 3 Steps involved in it

Get step-by-step solutions from verified subject matter experts