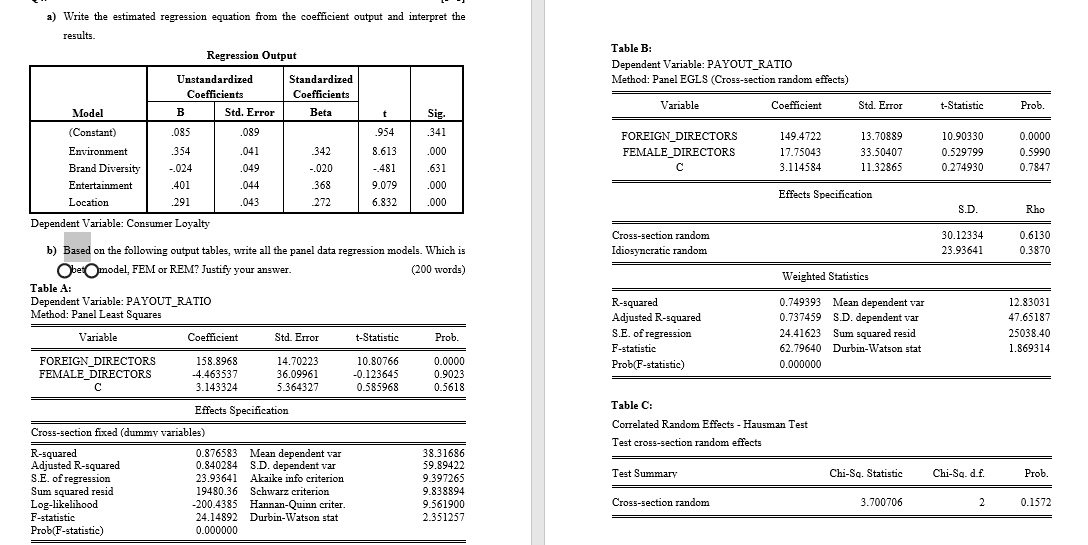
Question: a) Write the estimated regression equation from the coefficient output and interpret the results. Regression Output Table B: Dependent Variable: PAYOUT_RATIO Method: Panel EGLS (Cross-section

a) Write the estimated regression equation from

a) Write the estimated regression equation from the coefficient output and interpret the results. Regression Output Table B: Dependent Variable: PAYOUT_RATIO Method: Panel EGLS (Cross-section random effects) Standardized Coefficients Beta Variable Coefficient Std. Error t-Statistic Prob. t Sig 341 Unstandardized Coefficients Model B Std. Error (Constant) .085 .089 Environment 354 .041 Brand Diversity -024 .049 Entertainment 401 .044 Location .291 .043 Dependent Variable: Consumer Loyalty .954 8.613 -481 .000 FOREIGN_DIRECTORS FEMALE_DIRECTORS 149.4722 17.75043 3.114584 13.70889 33.50407 11.32865 10.90330 0.529799 0.274930 0.0000 0.5990 0.7847 342 -.020 368 272 9.079 6.832 631 .000 .000 Effects Specification S.D. Rho Cross-section random Idiosyncratic random 30.12334 23.93641 0.6130 0.3870 Weighted Statistics b) Based on the following output tables, write all the panel data regression models. Which is Obermodel, FEM or REM? Justify your answer. (200 words) Table A: Dependent Variable: PAYOUT_RATIO Method: Panel Least Squares Variable Coefficient Std. Error t-Statistic Prob. FOREIGN DIRECTORS 158.8968 14.70223 10.80766 0.0000 FEMALE DIRECTORS -4.463537 36.09961 -0.123645 0.9023 3.143324 5.364327 0.585968 0.5618 R-squared Adjusted R-squared S.E. of regression F-statistic Prob(F-statistic) 0.749393 Mean dependent var 0.737459 S.D. dependent var 24.41623 Sum squared resid 62.79640 Durbin-Watson stat 0.000000 12.83031 47.65187 25038.40 1.869314 Effects Specification Table C: Correlated Random Effects - Hausman Test Test cross-section random effects Test Summary Chi-Sq. Statistic Chi-Sq.d.f. Prob. Cross-section fixed (dummy variables) R-squared 0.876583 Mean dependent var Adjusted R-squared 0.840284 S.D. dependent var S.E. of regression 23.93641 Akaike info criterion Sum squared resid 19480.36 Schwarz criterion Log-likelihood -200.4385 Hannan-Quinn criter. F-statistic 24.14892 Durbin-Watson stat Prob(F-statistic) 0.000000 38.31686 59.89422 9.397265 9.838894 9.561900 2.351257 Cross-section random 3.700706 2 0.1572 a) Write the estimated regression equation from the coefficient output and interpret the results. Regression Output Table B: Dependent Variable: PAYOUT_RATIO Method: Panel EGLS (Cross-section random effects) Standardized Coefficients Beta Variable Coefficient Std. Error t-Statistic Prob. t Sig 341 Unstandardized Coefficients Model B Std. Error (Constant) .085 .089 Environment 354 .041 Brand Diversity -024 .049 Entertainment 401 .044 Location .291 .043 Dependent Variable: Consumer Loyalty .954 8.613 -481 .000 FOREIGN_DIRECTORS FEMALE_DIRECTORS 149.4722 17.75043 3.114584 13.70889 33.50407 11.32865 10.90330 0.529799 0.274930 0.0000 0.5990 0.7847 342 -.020 368 272 9.079 6.832 631 .000 .000 Effects Specification S.D. Rho Cross-section random Idiosyncratic random 30.12334 23.93641 0.6130 0.3870 Weighted Statistics b) Based on the following output tables, write all the panel data regression models. Which is Obermodel, FEM or REM? Justify your answer. (200 words) Table A: Dependent Variable: PAYOUT_RATIO Method: Panel Least Squares Variable Coefficient Std. Error t-Statistic Prob. FOREIGN DIRECTORS 158.8968 14.70223 10.80766 0.0000 FEMALE DIRECTORS -4.463537 36.09961 -0.123645 0.9023 3.143324 5.364327 0.585968 0.5618 R-squared Adjusted R-squared S.E. of regression F-statistic Prob(F-statistic) 0.749393 Mean dependent var 0.737459 S.D. dependent var 24.41623 Sum squared resid 62.79640 Durbin-Watson stat 0.000000 12.83031 47.65187 25038.40 1.869314 Effects Specification Table C: Correlated Random Effects - Hausman Test Test cross-section random effects Test Summary Chi-Sq. Statistic Chi-Sq.d.f. Prob. Cross-section fixed (dummy variables) R-squared 0.876583 Mean dependent var Adjusted R-squared 0.840284 S.D. dependent var S.E. of regression 23.93641 Akaike info criterion Sum squared resid 19480.36 Schwarz criterion Log-likelihood -200.4385 Hannan-Quinn criter. F-statistic 24.14892 Durbin-Watson stat Prob(F-statistic) 0.000000 38.31686 59.89422 9.397265 9.838894 9.561900 2.351257 Cross-section random 3.700706 2 0.1572

Step by Step Solution

There are 3 Steps involved in it

1 Expert Approved Answer
Step: 1 Unlock blur-text-image
Question Has Been Solved by an Expert!

Get step-by-step solutions from verified subject matter experts

Step: 2 Unlock
Step: 3 Unlock

Students Have Also Explored These Related General Management Questions!