

Question: Please analyze the financial data for 2020 and 2019 Intel Corporation. Discuss any significant trends between the two years. Provide a possible explanation for the
Please analyze the financial data for 2020 and 2019 Intel Corporation. Discuss any significant trends between the two years. Provide a possible explanation for the identified trends.
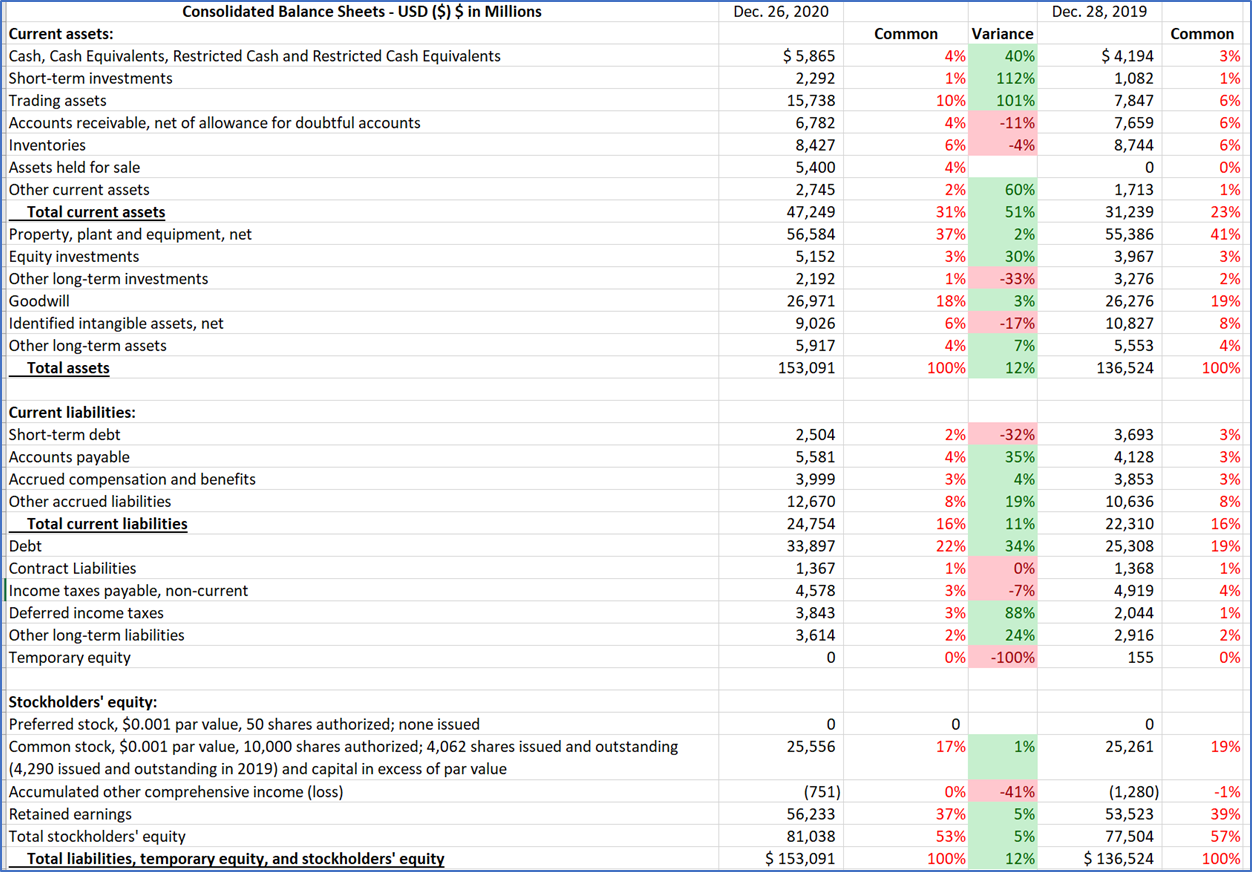
Dec. 26, 2020 Dec. 28, 2019 Consolidated Balance Sheets - USD ($) $ in Millions Current assets: Cash, Cash Equivalents, Restricted Cash and Restricted Cash Equivalents Short-term investments Trading assets Accounts receivable, net of allowance for doubtful accounts Inventories Assets held for sale Other current assets Total current assets Property, plant and equipment, net Equity investments Other long-term investments Goodwill Identified intangible assets, net Other long-term assets Total assets $ 5,865 2,292 15,738 6,782 8,427 5,400 2,745 47,249 56,584 5,152 2,192 26,971 9,026 5,917 153,091 Common Variance 4% 40% 1% 112% 10% 101% 4% -11% 6% -4% 4% 2% 60% 31% 51% 37% 2% 3% 30% 1% -33% 18% 3% 6% -17% 4% 7% 100% 12% $ 4,194 1,082 7,847 7,659 8,744 0 1,713 31,239 55,386 3,967 3,276 26,276 10,827 5,553 136,524 Common 3% 1% 6% 6% 6% 0% 1% 23% 41% 3% 2% 19% 8% 4% 100% -32% 35% 4% 19% Current liabilities: Short-term debt Accounts payable Accrued compensation and benefits Other accrued liabilities Total current liabilities Debt Contract Liabilities Income taxes payable, non-current Deferred income taxes Other long-term liabilities Temporary equity 2,504 5,581 3,999 12,670 24,754 33,897 1,367 4,578 3,843 3,614 0 2% 4% 3% 8% 16% 22% 1% 3% 3% 2% 0% 3,693 4,128 3,853 10,636 22,310 25,308 1,368 4,919 11% 34% 0% -7% 88% 24% - 100% 3% 3% 3% 8% 16% 19% 1% 4% 1% 2% 0% 2,044 2,916 155 0 25,556 0 17% 0 25,261 1% 19% Stockholders' equity: Preferred stock, $0.001 par value, 50 shares authorized; none issued Common stock, $0.001 par value, 10,000 shares authorized; 4,062 shares issued and outstanding (4,290 issued and outstanding in 2019) and capital in excess of par value Accumulated other comprehensive income (loss) Retained earnings Total stockholders' equity Total liabilities, temporary equity, and stockholders' equity (751) 56,233 81,038 $ 153,091 0% 37% 53% 100% -41% 5% 5% 12% (1,280) 53,523 77,504 $ 136,524 -1% 39% 57% 100% Dec. 26, 2020 Dec. 28, 2019 Consolidated Balance Sheets - USD ($) $ in Millions Current assets: Cash, Cash Equivalents, Restricted Cash and Restricted Cash Equivalents Short-term investments Trading assets Accounts receivable, net of allowance for doubtful accounts Inventories Assets held for sale Other current assets Total current assets Property, plant and equipment, net Equity investments Other long-term investments Goodwill Identified intangible assets, net Other long-term assets Total assets $ 5,865 2,292 15,738 6,782 8,427 5,400 2,745 47,249 56,584 5,152 2,192 26,971 9,026 5,917 153,091 Common Variance 4% 40% 1% 112% 10% 101% 4% -11% 6% -4% 4% 2% 60% 31% 51% 37% 2% 3% 30% 1% -33% 18% 3% 6% -17% 4% 7% 100% 12% $ 4,194 1,082 7,847 7,659 8,744 0 1,713 31,239 55,386 3,967 3,276 26,276 10,827 5,553 136,524 Common 3% 1% 6% 6% 6% 0% 1% 23% 41% 3% 2% 19% 8% 4% 100% -32% 35% 4% 19% Current liabilities: Short-term debt Accounts payable Accrued compensation and benefits Other accrued liabilities Total current liabilities Debt Contract Liabilities Income taxes payable, non-current Deferred income taxes Other long-term liabilities Temporary equity 2,504 5,581 3,999 12,670 24,754 33,897 1,367 4,578 3,843 3,614 0 2% 4% 3% 8% 16% 22% 1% 3% 3% 2% 0% 3,693 4,128 3,853 10,636 22,310 25,308 1,368 4,919 11% 34% 0% -7% 88% 24% - 100% 3% 3% 3% 8% 16% 19% 1% 4% 1% 2% 0% 2,044 2,916 155 0 25,556 0 17% 0 25,261 1% 19% Stockholders' equity: Preferred stock, $0.001 par value, 50 shares authorized; none issued Common stock, $0.001 par value, 10,000 shares authorized; 4,062 shares issued and outstanding (4,290 issued and outstanding in 2019) and capital in excess of par value Accumulated other comprehensive income (loss) Retained earnings Total stockholders' equity Total liabilities, temporary equity, and stockholders' equity (751) 56,233 81,038 $ 153,091 0% 37% 53% 100% -41% 5% 5% 12% (1,280) 53,523 77,504 $ 136,524 -1% 39% 57% 100%
Step by Step Solution
There are 3 Steps involved in it

Get step-by-step solutions from verified subject matter experts