

Question: please answer 1, 2, a, b . Perceptual Maps The construction of a perceptual map helps marketing strategists better understand the positioning of their product/service,
please answer 1, 2, a, b
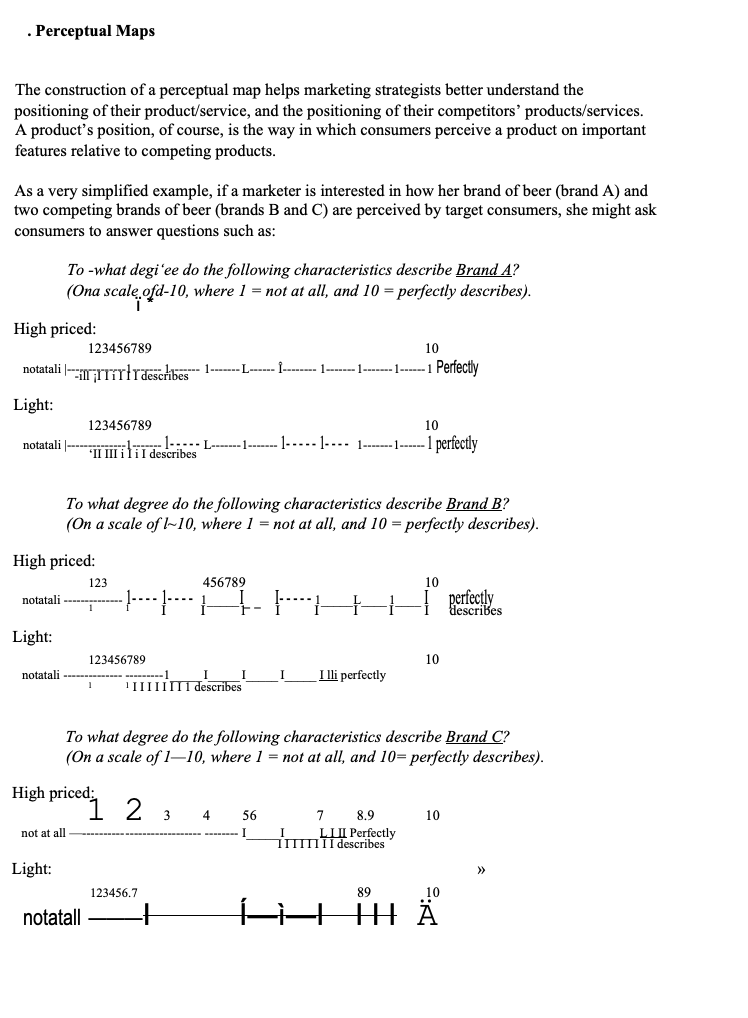
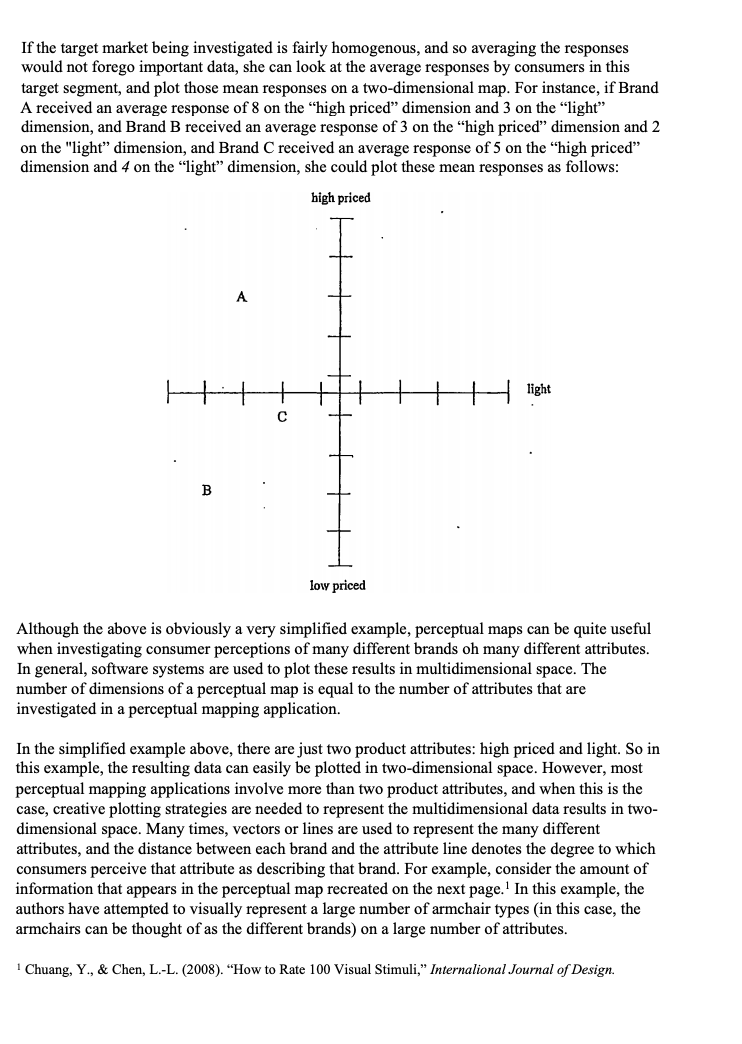
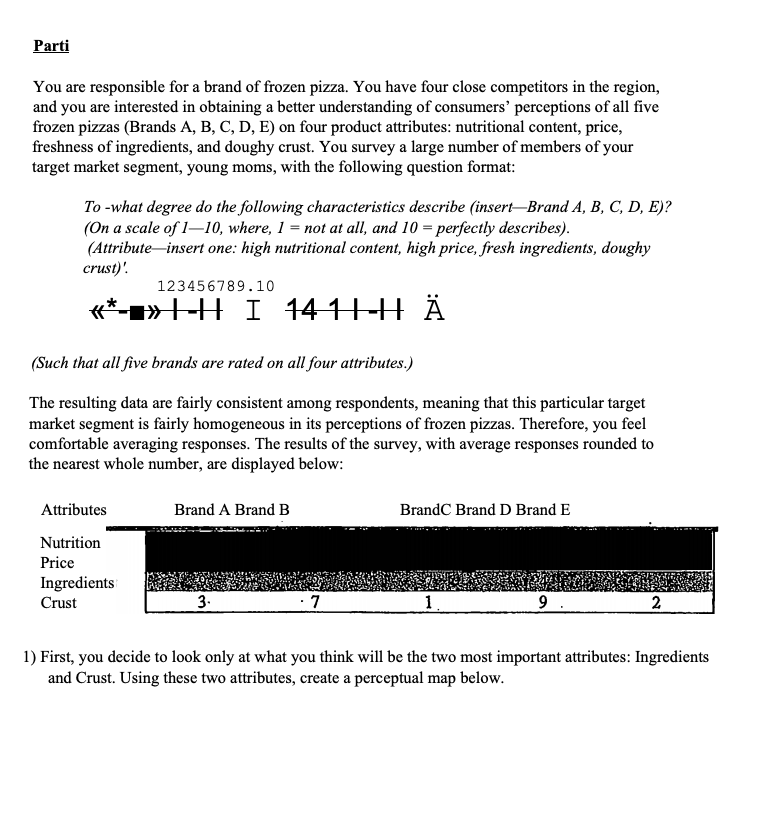
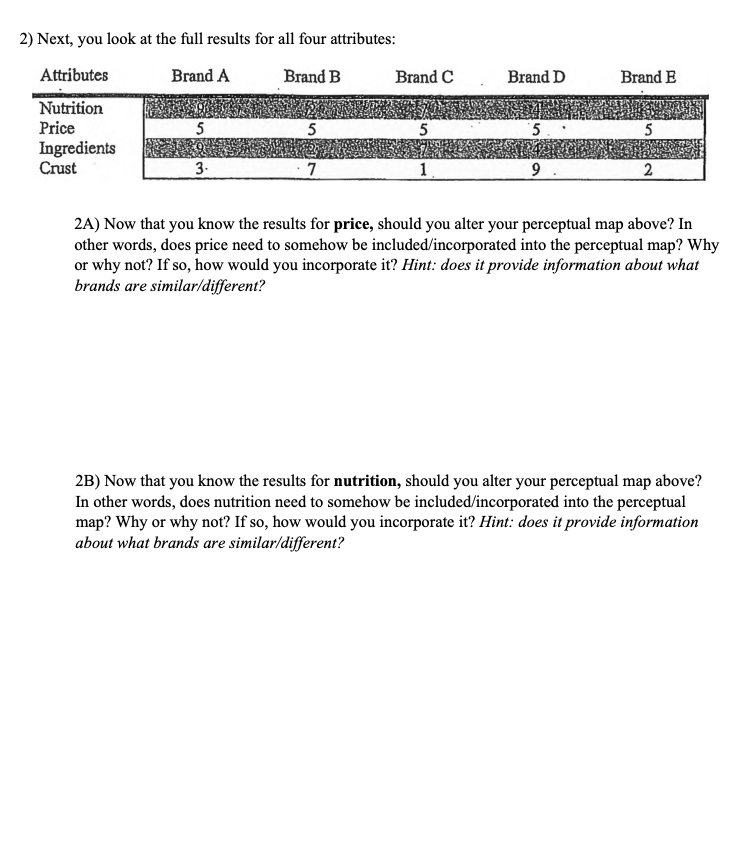
. Perceptual Maps The construction of a perceptual map helps marketing strategists better understand the positioning of their product/service, and the positioning of their competitors' products/services. A product's position, of course, is the way in which consumers perceive a product on important features relative to competing products. As a very simplified example, if a marketer is interested in how her brand of beer (brand A) and two competing brands of beer (brands B and C) are perceived by target consumers, she might ask consumers to answer questions such as: To -what degi'ee do the following characteristics describe Brand A? (Ona scale ofd-10, where 1 = not at all, and 10 = perfectly describes). High priced: 123456789 10 notatall _ITYlrdescribes - 1------L----- 1-.. -1-------1------ 1 Perfectly Light: 123456789 10 notatali |-- nine L-1-....1-.... 1...- 1--1-.. 1 perfectly To what degree do the following characteristics describe Brand B? (On a scale of 1-10, where I = not at all, and 10 = perfectly describes). High priced: 123 456789 10 notatali - perfectly describes Light: 123456789 10 notatali --1 I lli perfectly IIIIIIII describes To what degree do the following characteristics describe Brand C? (On a scale of 1-10, where I = not at all, and 10= perfectly describes). High priced; 1 2 3 4 56 7 8.9 10 not at all L III Perfectly ITTTTIII describes Light: 123456.7 89 10 notatall HHAIfthe target market being investigated is fairly homogenous, and so averaging the responses would not forego important data, she can look at the average responses by consumers in this target segment, and plot those mean responses on a two-dimensional map. For instance, if Brand A received an average response of 8 on the \"high priced\" dimension and 3 on the \"light" dimension, and Brand B received an average response of 3 on the \"high priced\" dimension and 2 on the "light\" dimension, and Brand C received an average response of 5 on the \"high priced\" dimension and 4 on the \"light" dimension, she could plot these mean responses as follows: Mahmud 1mm Although the above is obviously a very simplied example, perceptual maps can be quite useful when investigating consumer perceptions of many different brands oh many different attributes. In general, software systems are used to plot these results in multidimensional space. The number of dimensions of a perceptual map is equal to the number of attributes that are investigated in a perceptual mapping application. In the simplied example above, there are just two product attributes: high priced and light. So in this example, the resulting data can easily be plotted in two-dimensional space. However, most perceptual mapping applications involve more than two product attributes, and when this is the case, creative plotting strategies are needed to represent the multidimensional data results in two- dimensional space. Many times, vectors or lines are used to represent the many different attributes, and the distance between each brand and the attribute line denotes the degree to which consumers perceive that attribute as describing that brand. For example, consider the amount of information that appears in the perceptual map recreated on the next page.1 In this example, the authors have attempted to visually represent a large number of armchair types (in this case, the armchairs can be thought of as the different brands) on a large number of attributes. ' Chuang, Y., & Chen, L.-L. (2008). \"How to Rate 100 Visual Stimuli,\" IntermfiomiJounmf ofDesigm Parti You are responsible for a brand of frozen pizza. You have four close competitors in the region, and you are interested in obtaining a better understanding of consumers' perceptions of all five frozen pizzas (Brands A, B, C, D, E) on four product attributes: nutritional content, price, freshness of ingredients, and doughy crust. You survey a large number of members of your target market segment, young moms, with the following question format: To -what degree do the following characteristics describe (insert-Brand A, B, C, D, E)? (On a scale of 1-10, where, I = not at all, and 10 = perfectly describes). (Attribute-insert one: high nutritional content, high price, fresh ingredients, doughy crust)' 123456789. 10 I-H I 141I-HA (Such that all five brands are rated on all four attributes.) The resulting data are fairly consistent among respondents, meaning that this particular target market segment is fairly homogeneous in its perceptions of frozen pizzas. Therefore, you feel comfortable averaging responses. The results of the survey, with average responses rounded to the nearest whole number, are displayed below: Attributes Brand A Brand B BrandC Brand D Brand E Nutrition Price Ingredients Crust 3- 2 1) First, you decide to look only at what you think will be the two most important attributes: Ingredients and Crust. Using these two attributes, create a perceptual map below.2) Next, you look at the full results for all four attributes: Attributes Brand A Brand B Brand C Brand D Brand E Nutrition Price 5 Ingredients Crust 3. 9 2 2A) Now that you know the results for price, should you alter your perceptual map above? In other words, does price need to somehow be included/incorporated into the perceptual map? Why or why not? If so, how would you incorporate it? Hint: does it provide information about what brands are similar/different? 2B) Now that you know the results for nutrition, should you alter your perceptual map above? In other words, does nutrition need to somehow be included/incorporated into the perceptual map? Why or why not? If so, how would you incorporate it? Hint: does it provide information about what brands are similar/different
Step by Step Solution
There are 3 Steps involved in it

Get step-by-step solutions from verified subject matter experts