

Question: PLEASE ANSWER 1 - 6 ! Attached photos show all info. Napa Valley Winery has sought your expertise to help them compare forecasted sales using
PLEASE ANSWER Attached photos show all info.
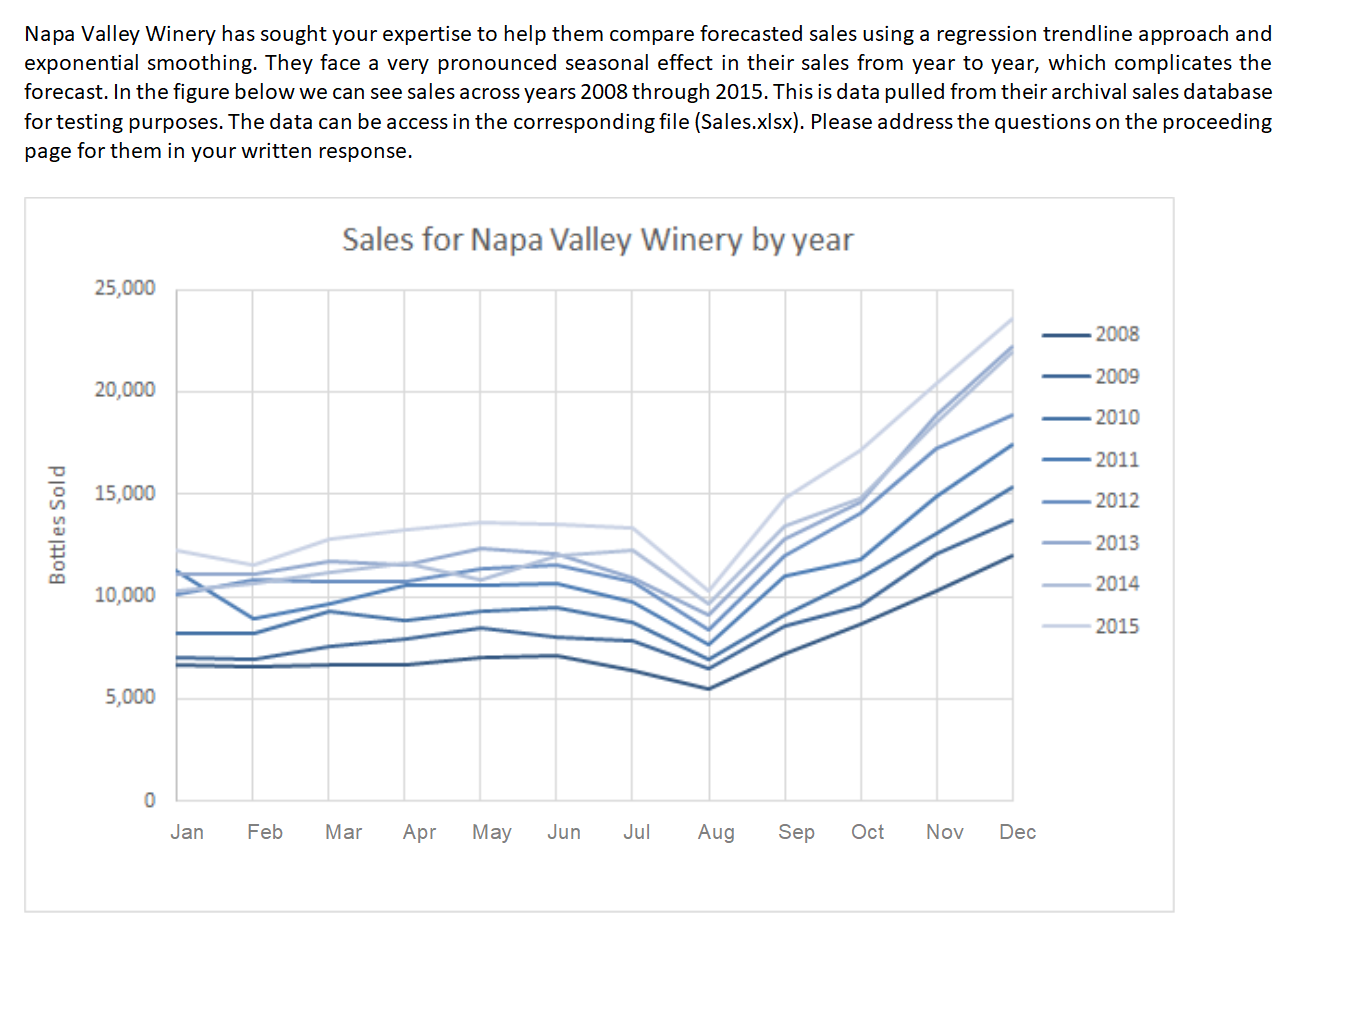
Napa Valley Winery has sought your expertise to help them compare forecasted sales using a regression trendline approach and
exponential smoothing. They face a very pronounced seasonal effect in their sales from year to year, which complicates the
forecast. In the figure below we can see sales across years through This is data pulled from their archival sales database
for testing purposes. The data can be access in the corresponding file Salesxlsx Develop a linear regression trendline for the data provided from What is the regression equation?
Use the regression equation from question to obtain forecasted sales for Jan Dec ie months Insert
your forecasted sales in the "Regress Sale Forecast column in the Table below. Next, calculate the forecast errors for
Jan Dec ie months Insert your forecast error values in the "Forecast Error FE column in Table below.
For your answer, provide a copy of Table with your answers inserted in the requested cells.
Table : Sales Data and Regression Forecast
Use the data obtained in Table to calculate the Mean Absolute Percentage Error MAPE for when using your
regression equation to forecast sales. You must show your work for credit.
Use exponential smoothing with an alpha value of to obtain forecasted sales for Jan Dec ie months
Note that you will need the Actual Sales from Dec ie month and a forecast from month use the
Nave Method to get the first exponential smoothing forecast. These values can be obtained from the data file provided.
Insert your forecasted sales in the "Exponential Smoothing Sales Forecast column in the Table below. Next, calculate
the forecast errors for Jan Dec ie months Insert your forecast error values in the "Forecast Error
column in Table below. For your answer, provide a copy of Table with your answers inserted in the requested cells.
Table : Sales Data and Exponential Smoothing Forecast Use the data obtained in Table to calculate the Mean Absolute Percentage Error MAPE for when using the
Exponential Smoothing method to forecast sales. You must show your work for credit.
Which method would you recommend for Napa Valley Winery to use to forecast their sales moving forward? Justify your
answer with a detailed explanation, making sure to also discuss any potential differences in the Mean Absolute Percentage
Errors between the two methods. Please address the questions on the proceeding
page for them in your written response.
Step by Step Solution
There are 3 Steps involved in it
1 Expert Approved Answer
Step: 1 Unlock

Question Has Been Solved by an Expert!
Get step-by-step solutions from verified subject matter experts
Step: 2 Unlock
Step: 3 Unlock