

Question: Please answer #16-18. Please show work and explain how you got to the answer. EXHIBIT 1 Summary Statistics Debt Ratio , Short Interest Ratio Y
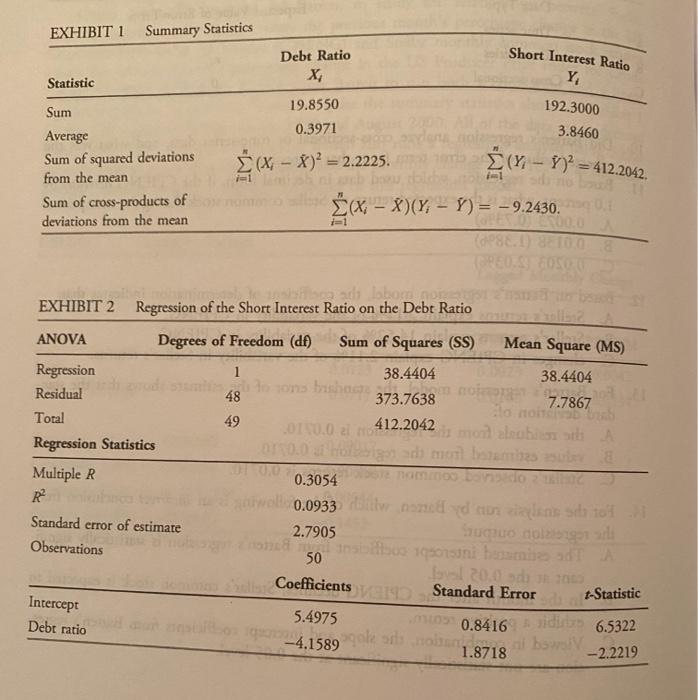
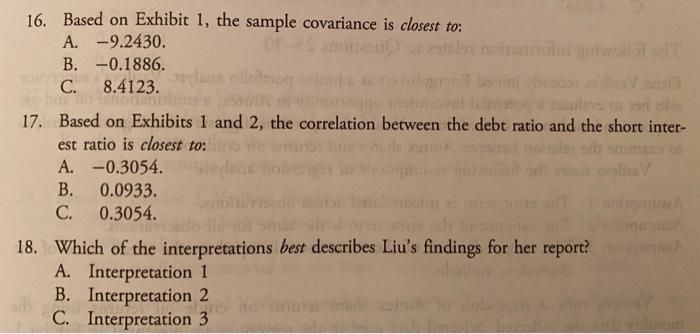
EXHIBIT 1 Summary Statistics Debt Ratio , Short Interest Ratio Y Statistic 19.8550 0.3971 192.3000 3.8460 Sum Average Sum of squared deviations from the mean Sum of cross-products of deviations from the mean (X - X) = 2.2225. (Y - 7)* = 412.2042 1-1 * X - X)(Y, - Y) = -9.2430. ads tobom EXHIBIT 2 Regression of the Short Interest Ratio on the Debt Ratio ANOVA Degrees of Freedom (df) Sum of Squares (SS) Mean Square (MS) Regression 1 38.4404 38.4404 Residual ons ha no 48 373.7638 7.7867 So Total 49 412.2042 OTC0.0 24 42 maleabi at A Regression Statistics 0.0 8 Multiple R 0.3054 R 0.0933 noned to stop Standard error of estimate 2.7905 Sucuo dolga Observations 50 ni hamis adA 120.00 Dalla Coefficients Standard Error -Statistic Intercept 5.4975 Mo 0.8416 olan, selbst 1.8718 -2.2219 Debt ratio 6.5322 -4.1589 16. Based on Exhibit 1, the sample covariance is closest to: A. -9.2430. B. -0.1886. C. 8.4123 17. Based on Exhibits 1 and 2, the correlation between the debt ratio and the short inter- est ratio is closest to: A. -0.3054. B. 0.0933. C. 0.3054. 18. Which of the interpretations best describes Liu's findings for her report? A. Interpretation 1 B. Interpretation 2 C. Interpretation 3
Step by Step Solution
There are 3 Steps involved in it

Get step-by-step solutions from verified subject matter experts