

Question: Please answer 1-7 clearly and correctly Please show all the work Step by step in different paper Thank you Problem 1 Problem 4 In a
Please answer 1-7 clearly and correctly Please show all the work Step by step in different paper Thank you

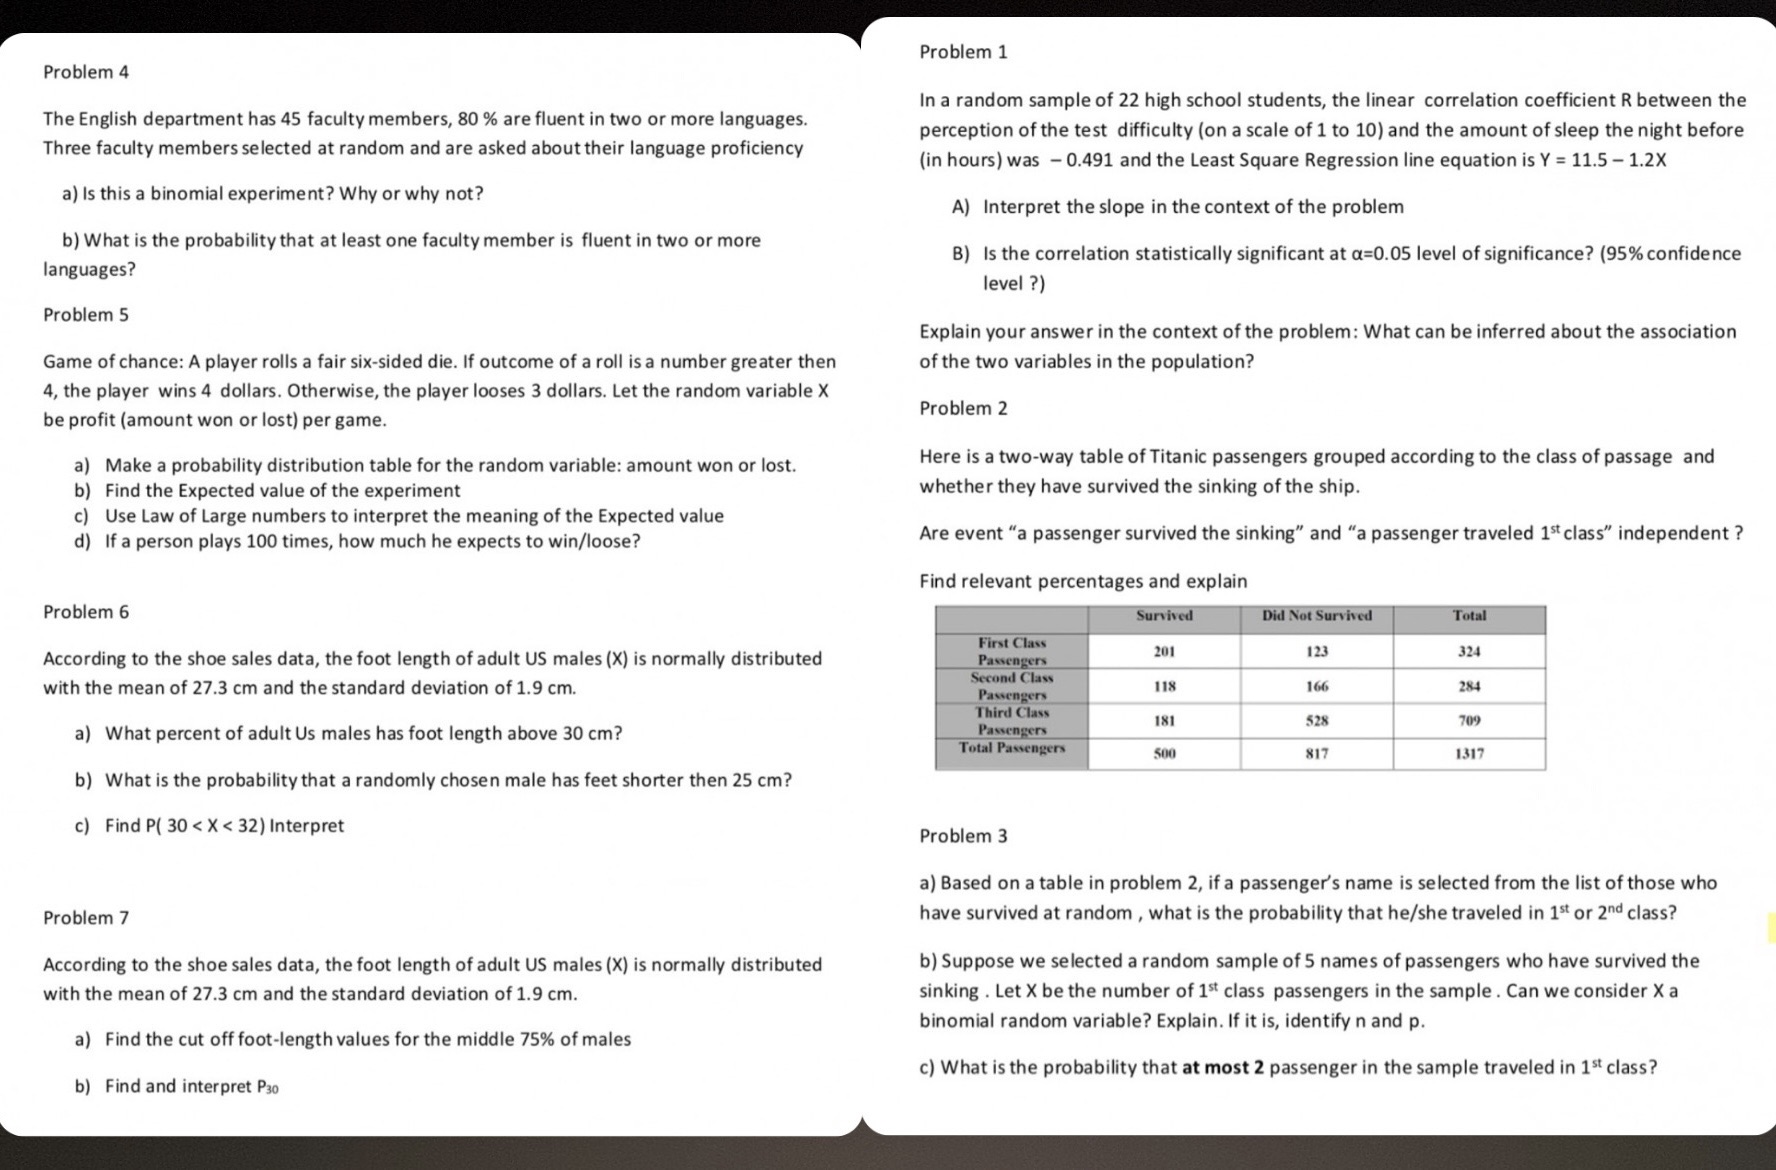
Problem 1 Problem 4 In a random sample of 22 high school students, the linear correlation coefficient R between the The English department has 45 faculty members, 80% are fluent in two or more languages. perception of the test difficulty (on a scale of 1 to 10) and the amount of sleep the night before Three faculty members selected at random and are asked about their language proficiency (in hours) was - 0.491 and the Least Square Regression line equation is Y = 11.5 - 1.2X a) Is this a binomial experiment? Why or why not? A) Interpret the slope in the context of the problem b) What is the probability that at least one faculty member is fluent in two or more B) Is the correlation statistically significant at a=0.05 level of significance? (95% confidence languages? level ?) Problem 5 Explain your answer in the context of the problem: What can be inferred about the association Game of chance: A player rolls a fair six-sided die. If outcome of a roll is a number greater then of the two variables in the population? 4, the player wins 4 dollars. Otherwise, the player looses 3 dollars. Let the random variable X be profit (amount won or lost) per game. Problem 2 a) Make a probability distribution table for the random variable: amount won or lost. Here is a two-way table of Titanic passengers grouped according to the class of passage and b) Find the Expected value of the experiment whether they have survived the sinking of the ship. c) Use Law of Large numbers to interpret the meaning of the Expected value d) If a person plays 100 times, how much he expects to win/loose? Are event "a passenger survived the sinking" and "a passenger traveled 1st class" independent ? Find relevant percentages and explain Problem 6 Survived Did Not Survived Total First Class According to the shoe sales data, the foot length of adult US males (X) is normally distributed 201 123 324 Passengers with the mean of 27.3 cm and the standard deviation of 1.9 cm. Second Class 118 166 284 Passengers Third Class 181 528 709 a) What percent of adult Us males has foot length above 30 cm? Passengers Total Passengers 500 817 1317 b) What is the probability that a randomly chosen male has feet shorter then 25 cm? c) Find P( 30
Step by Step Solution
There are 3 Steps involved in it

Get step-by-step solutions from verified subject matter experts