

Question: please answer 31 & 32 Consider the following Data for questions # 27 - 31 Project A Initial Year 1 Year 2 Year 3 Year
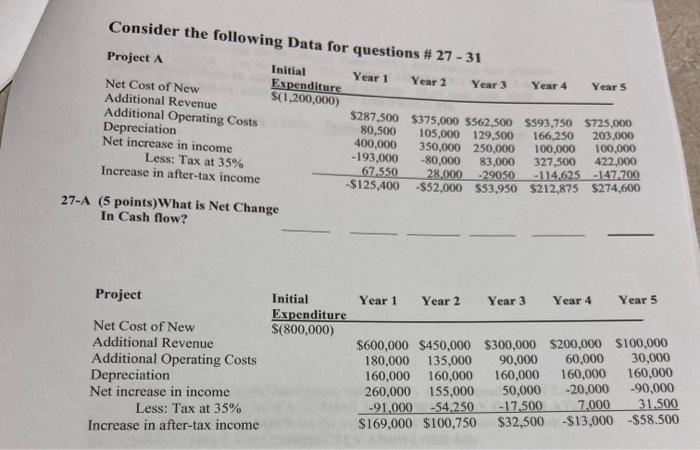
Consider the following Data for questions # 27 - 31 Project A Initial Year 1 Year 2 Year 3 Year 4 Years Net Cost of New Expenditure Additional Revenue $(1,200,000) Additional Operating Costs $287,500 $375,000 $562,500 $593,750 $725,000 Depreciation 80,500 105,000 129,500 166,250 203.000 Net increase in income 400,000 350.000 250.000 100,000 100,000 -193,000 -80,000 Less: Tax at 35% 327,500 422.000 83.000 67.550 28.000 -29050 -114.625 Increase in after-tax income -147.700 -$125,400 $52,000 $53,950 $212,875 $274,600 27-A (5 points)What is Net Change In Cash flow? Project Year 1 Year 2 Year 3 Year 4 Year 5 Initial Expenditure $(800,000) Net Cost of New Additional Revenue Additional Operating Costs Depreciation Net increase in income Less: Tax at 35% Increase in after-tax income $600,000 $450,000 $300,000 $200,000 $100,000 180,000 135,000 90,000 60,000 30,000 160,000 160,000 160,000 160,000 160,000 260,000 155,000 50,000 -20,000 -90,000 -91,000 -54.250 -17,500 7.000 31.500 $169,000 $100,750 $32,500 -$13,000-$58.500 31. (10 points) Calculate the Productivity Index for Project A and for Project B. 32. (5 points) In comparing the results of Payback, NPV, IRR and the Productivity Index for Project A and Project B, which project will provide the greatest increase in wealth for the firm? Consider the following Data for questions # 27 - 31 Project A Initial Year 1 Year 2 Year 3 Year 4 Years Net Cost of New Expenditure Additional Revenue $(1,200,000) Additional Operating Costs $287,500 $375,000 $562,500 $593,750 $725,000 Depreciation 80,500 105,000 129,500 166,250 203.000 Net increase in income 400,000 350.000 250.000 100,000 100,000 -193,000 -80,000 Less: Tax at 35% 327,500 422.000 83.000 67.550 28.000 -29050 -114.625 Increase in after-tax income -147.700 -$125,400 $52,000 $53,950 $212,875 $274,600 27-A (5 points)What is Net Change In Cash flow? Project Year 1 Year 2 Year 3 Year 4 Year 5 Initial Expenditure $(800,000) Net Cost of New Additional Revenue Additional Operating Costs Depreciation Net increase in income Less: Tax at 35% Increase in after-tax income $600,000 $450,000 $300,000 $200,000 $100,000 180,000 135,000 90,000 60,000 30,000 160,000 160,000 160,000 160,000 160,000 260,000 155,000 50,000 -20,000 -90,000 -91,000 -54.250 -17,500 7.000 31.500 $169,000 $100,750 $32,500 -$13,000-$58.500 31. (10 points) Calculate the Productivity Index for Project A and for Project B. 32. (5 points) In comparing the results of Payback, NPV, IRR and the Productivity Index for Project A and Project B, which project will provide the greatest increase in wealth for the firm
Step by Step Solution
There are 3 Steps involved in it

Get step-by-step solutions from verified subject matter experts