

Question: Please answer A, B, and C. Please show work! (Risk-return trade-off) Ramsey Liquors owns and operates a chain of beer and wine shops throughout the
 Please answer A, B, and C. Please show work!
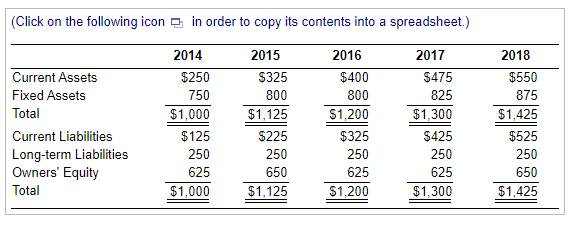
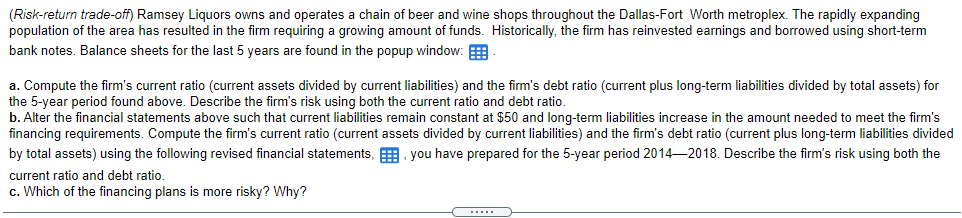
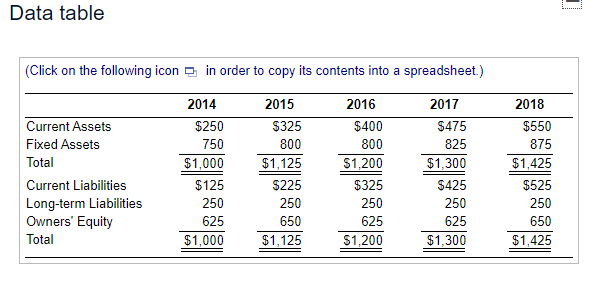
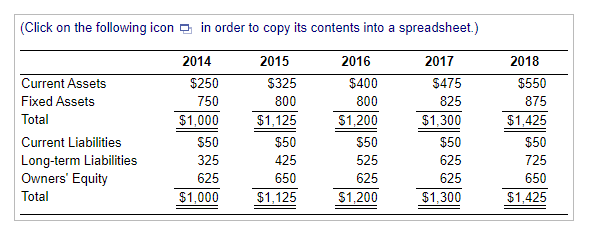
(Risk-return trade-off) Ramsey Liquors owns and operates a chain of beer and wine shops throughout the Dallas-Fort Worth metroplex. The rapidly expanding population of the area has resulted in the firm requiring a growing amount of funds. Historically, the firm has reinvested earnings and borrowed using short-term bank notes. Balance sheets for the last 5 years are found in the popup window: :: a. Compute the firm's current ratio (current assets divided by current liabilities) and the firm's debt ratio (current plus long-term liabilities divided by total assets) for the 5-year period found above. Describe the firm's risk using both the current ratio and debt ratio. b. Alter the financial statements above such that current liabilities remain constant at $50 and long-term liabilities increase in the amount needed to meet the firm's financing requirements. Compute the firm's current ratio (current assets divided by current liabilities) and the firm's debt ratio (current plus long-term liabilities divided by total assets) using the following revised financial statements, you have prepared for the 5-year period 20142018. Describe the firm's risk using both the current ratio and debt ratio. c. Which of the financing plans is more risky? Why? 1 Data table (Click on the following icon in order to copy its contents into a spreadsheet.) Current Assets Fixed Assets Total Current Liabilities Long-term Liabilities Owners' Equity Total 2014 $250 750 $1,000 $125 250 625 $1,000 2015 $325 800 $1,125 $225 250 650 $1,125 2016 $400 800 $1,200 $325 250 625 $1,200 2017 $475 825 $1,300 $425 250 625 $1,300 2018 $550 875 $1,425 $525 250 650 $1,425 (Click on the following icon in order to copy its contents into a spreadsheet.) Current Assets Fixed Assets Total Current Liabilities Long-term Liabilities Owners' Equity Total 2014 $250 750 $1,000 $50 325 625 $1,000 2015 $325 800 $1,125 $50 425 650 $1,125 2016 $400 800 $1,200 $50 525 625 $1,200 2017 $475 825 $1,300 $50 625 625 $1,300 2018 $550 875 $1,425 $50 725 650 $1,425 (Click on the following icon in order to copy its contents into a spreadsheet.) Current Assets Fixed Assets Total Current Liabilities Long-term Liabilities Owners' Equity Total 2014 $250 750 $1,000 $125 250 625 $1,000 2015 $325 800 $1,125 $225 250 650 $1,125 2016 $400 800 $1,200 $325 250 625 $1,200 2017 $475 825 $1,300 $425 250 625 $1,300 2018 $550 875 $1,425 $525 250 650 $1,425
Step by Step Solution
There are 3 Steps involved in it

Get step-by-step solutions from verified subject matter experts