

Question: Please answer a b c d 9. (12) The following diagram shows the investment opportunity set for portfolios containing stocks A and B. You need
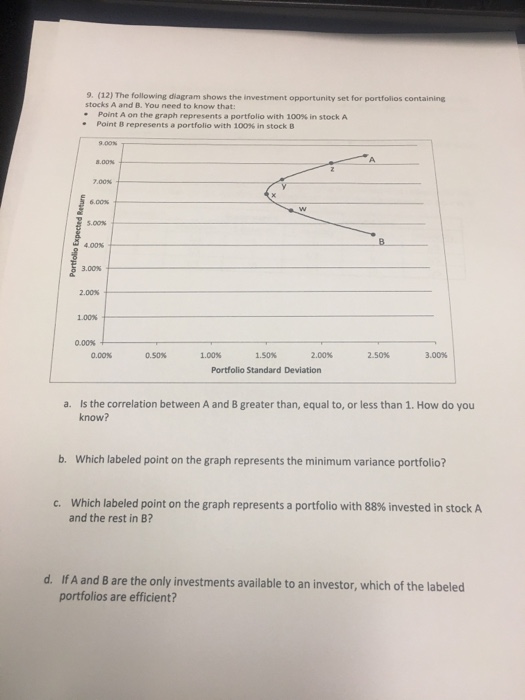
9. (12) The following diagram shows the investment opportunity set for portfolios containing stocks A and B. You need to know that: Point A on the graph represents a portfolio with 100% in stock A Point B represents a portfolio with 100% in stock B 7.00% 6.00% 5.00% 3.00% 2.00% 1.00% 0.00% + 0.00% 0.50% 1.00% 1.50% 2.00% 2.50% 3.00% Portfolio Standard Deviation Is the correlation between A and B greater than, equal to, or less than 1. How do you know? a. b. Which labeled point on the graph represents the minimum variance portfolio? which labeled point on the graph represents a portfolio with 88% invested in stock A and the rest in B? c, d. If A and B are the only investments available to an investor, which of the labeled portfolios are efficient
Step by Step Solution
There are 3 Steps involved in it

Get step-by-step solutions from verified subject matter experts