

Question: Question 10 3 points Save Answer The following diagram shows the investment opportunity set for portfolios containing stocks A and B, with Point A on
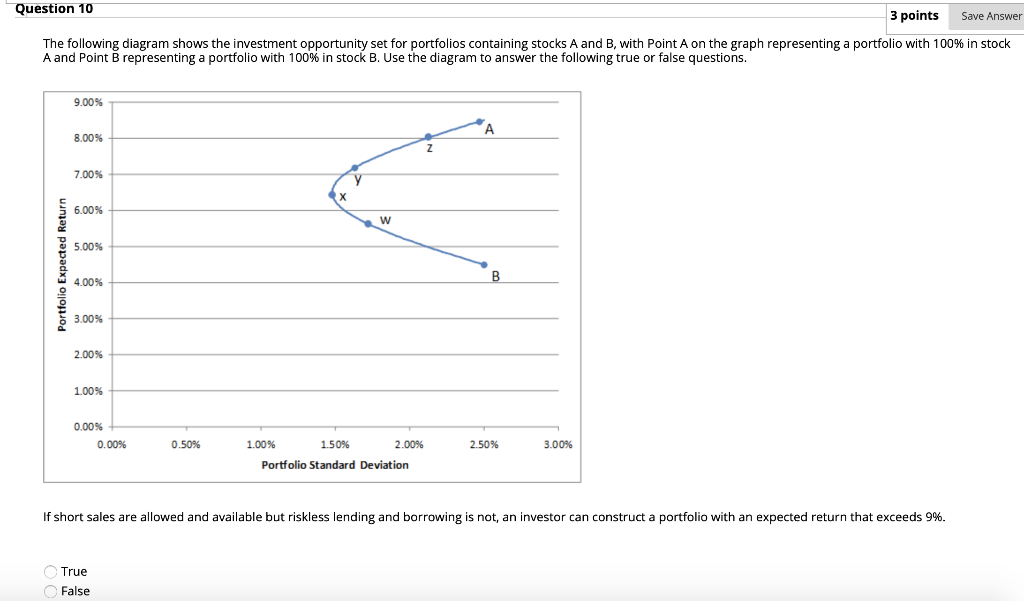
Question 10 3 points Save Answer The following diagram shows the investment opportunity set for portfolios containing stocks A and B, with Point A on the graph representing a portfolio with 100% in stock A and Point B representing a portfolio with 100% in stock B. Use the diagram to answer the following true or false questions. 9.00% 8.00% 7.00% 6.00% w 5.00% Portfolio Expected Return B 4.00% 3.00% 2.00% 1.00% 0.00% 0.00% 0.50% 1.00% 1.50% 2.00% 2.50% 3.00% Portfolio Standard Deviation If short sales are allowed and available but riskless lending and borrowing is not an investor can construct a portfolio with an expected return that exceeds 9%. True False
Step by Step Solution
There are 3 Steps involved in it

Get step-by-step solutions from verified subject matter experts