

Question: please answer a-c Implied Real Interest Rates. Use the table containing economic, financial, and business indicators to answer the following questions. If the nominal interest
please answer a-c
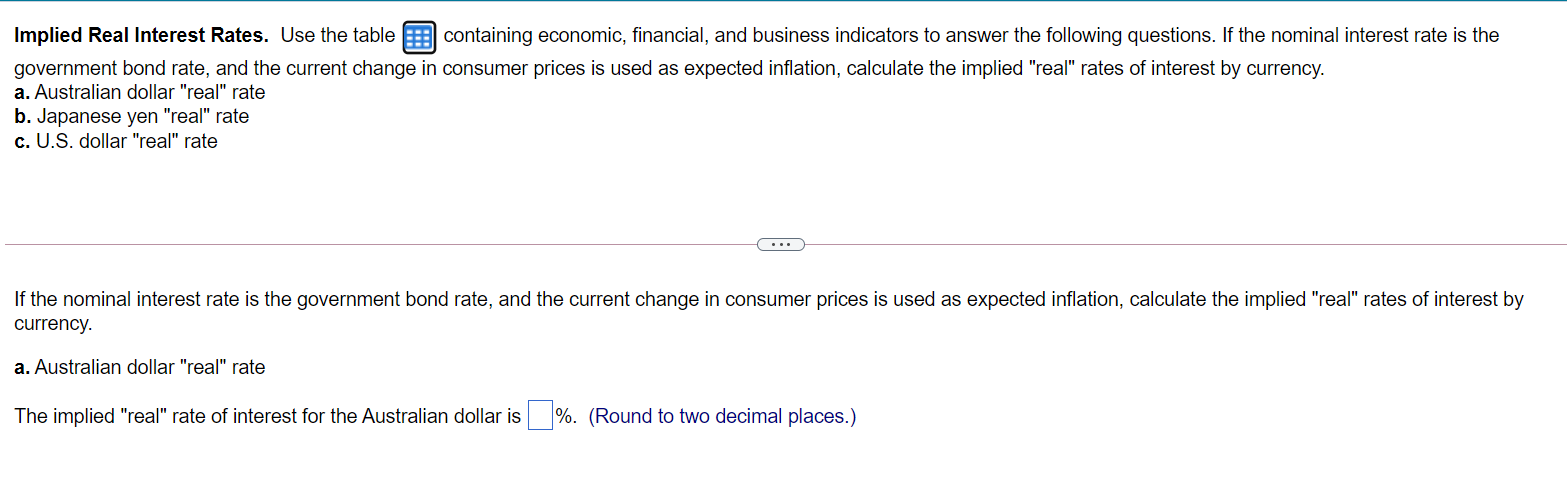
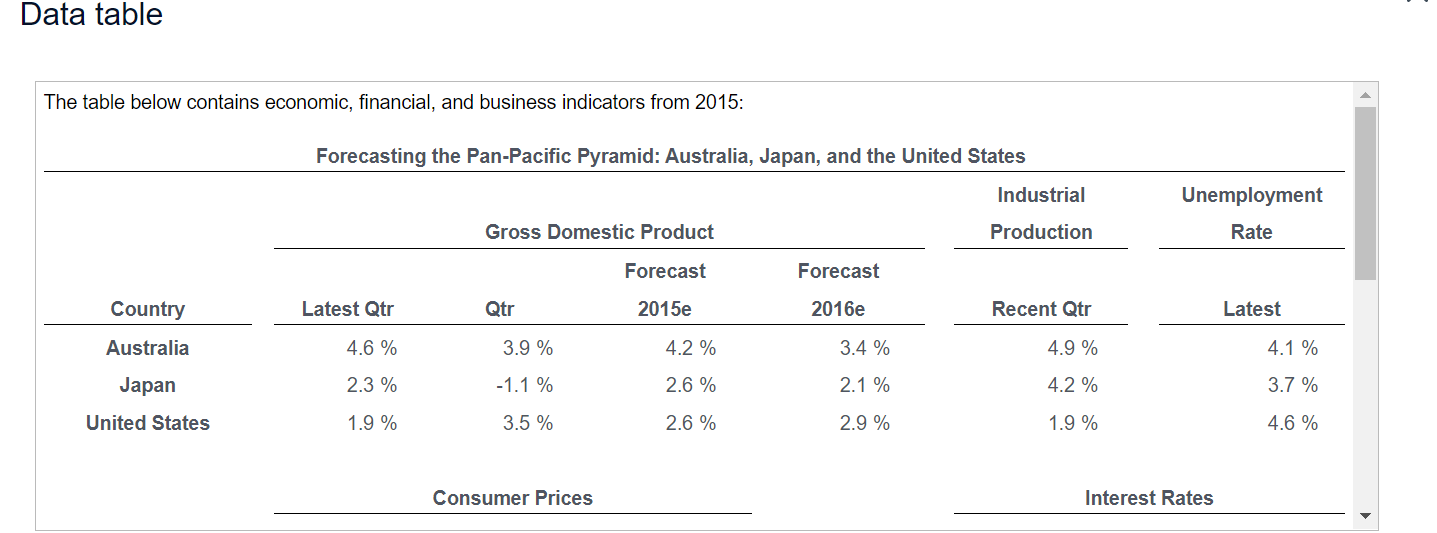
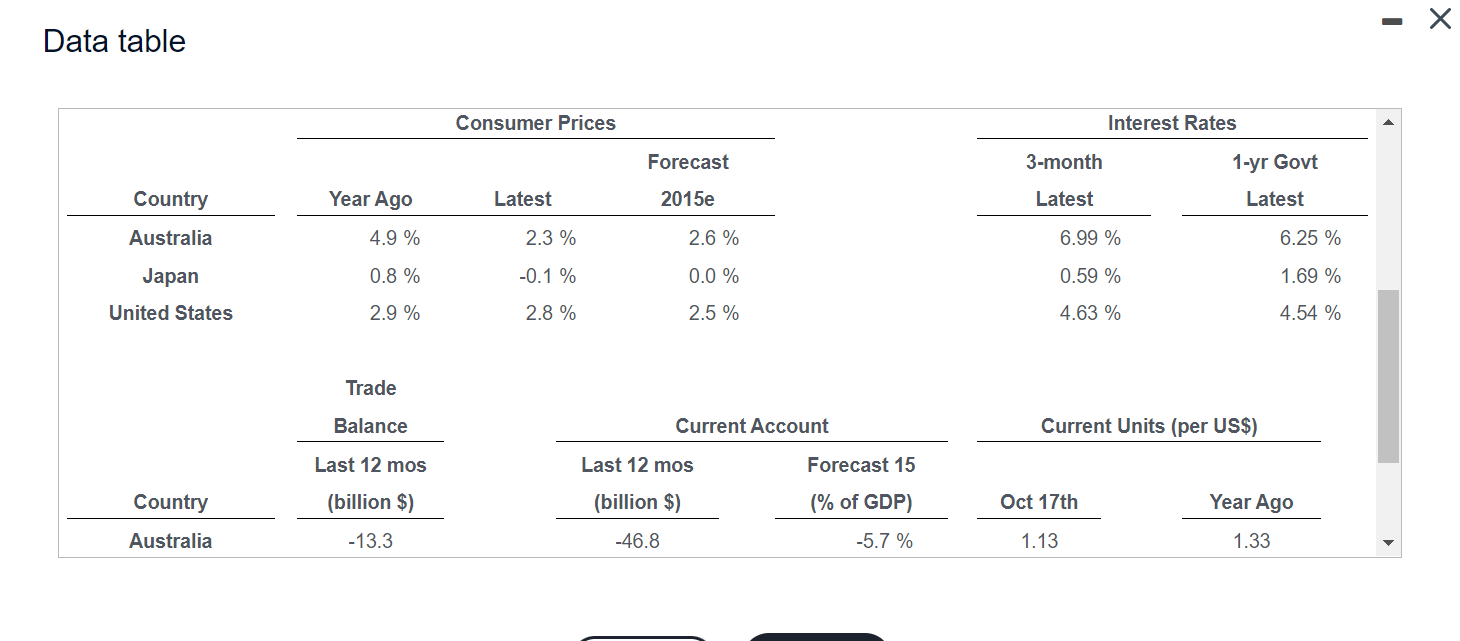
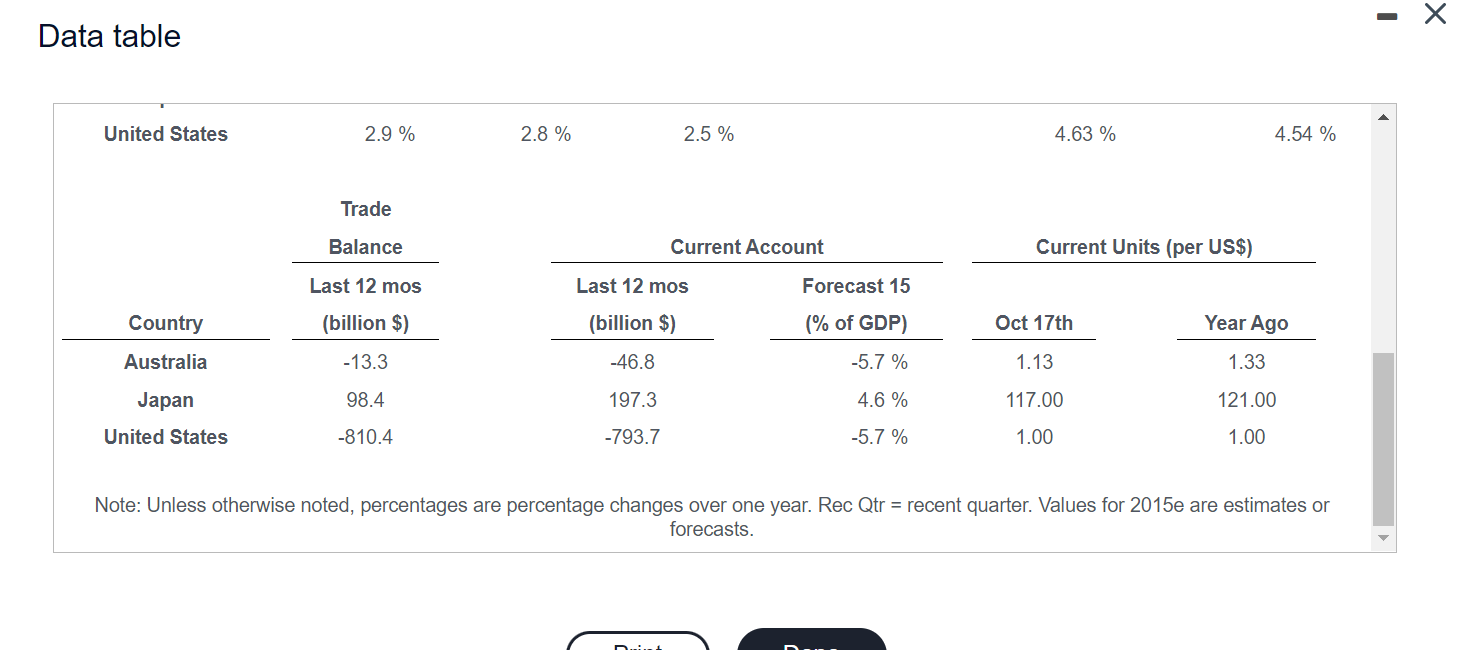
Implied Real Interest Rates. Use the table containing economic, financial, and business indicators to answer the following questions. If the nominal interest rate is the government bond rate, and the current change in consumer prices is used as expected inflation, calculate the implied "real" rates of interest by currency. a. Australian dollar "real" rate b. Japanese yen "real" rate c. U.S. dollar "real" rate If the nominal interest rate is the government bond rate, and the current change in consumer prices is used as expected inflation, calculate the implied "real" rates of interest by currency. a. Australian dollar "real" rate The implied "real" rate of interest for the Australian dollar is %. (Round to two decimal places.) Data table The table below contains economic, financial, and business indicators from 2015: Forecasting the Pan-Pacific Pyramid: Australia, Japan, and the United States Industrial Unemployment Gross Domestic Product Production Rate Forecast Forecast Country Latest Qtr Qtr 2015e 2016e Recent Qtr Latest Australia 4.6 % 3.9 % 4.2 % 3.4 % 4.9 % 4.1 % Japan 2.3 % -1.1 % 2.6 % 2.1 % 4.2 % 3.7 % United States 1.9 % 3.5 % 2.6 % 2.9 % 1.9 % 4.6 % Consumer Prices Interest Rates Data table Consumer Prices Interest Rates Forecast 3-month 1-yr Govt Country Year Ago Latest 2015e Latest Latest Australia 4.9 % 2.3 % 2.6 % 6.99 % 6.25 % 0.8 % -0.1 % 0.0 % 0.59 % 1.69 % Japan United States 2.9 % 2.8 % 2.5 % 4.63 % 4.54 % Trade Balance Current Account Current Units (per US$) Last 12 mos Last 12 mos Forecast 15 Country (billion $) (billion $) (% of GDP) Oct 17th Year Ago Australia -13.3 -46.8 -5.7 % 1.13 1.33 - Data table United States 2.9 % 2.8 % 2.5 % 4.63 % 4.54 % Trade Balance Current Account Current Units (per US$) Last 12 mos Last 12 mos Forecast 15 Country (billion $) (billion $) (% of GDP) Oct 17th Year Ago Australia -13.3 -46.8 -5.7 % 1.13 1.33 Japan 98.4 197.3 4.6 % 117.00 121.00 United States -810.4 -793.7 -5.7 % 1.00 1.00 Note: Unless otherwise noted, percentages are percentage changes over one year. Rec Qtr = recent quarter. Values for 2015e are estimates or forecasts. Implied Real Interest Rates. Use the table containing economic, financial, and business indicators to answer the following questions. If the nominal interest rate is the government bond rate, and the current change in consumer prices is used as expected inflation, calculate the implied "real" rates of interest by currency. a. Australian dollar "real" rate b. Japanese yen "real" rate c. U.S. dollar "real" rate If the nominal interest rate is the government bond rate, and the current change in consumer prices is used as expected inflation, calculate the implied "real" rates of interest by currency. a. Australian dollar "real" rate The implied "real" rate of interest for the Australian dollar is %. (Round to two decimal places.) Data table The table below contains economic, financial, and business indicators from 2015: Forecasting the Pan-Pacific Pyramid: Australia, Japan, and the United States Industrial Unemployment Gross Domestic Product Production Rate Forecast Forecast Country Latest Qtr Qtr 2015e 2016e Recent Qtr Latest Australia 4.6 % 3.9 % 4.2 % 3.4 % 4.9 % 4.1 % Japan 2.3 % -1.1 % 2.6 % 2.1 % 4.2 % 3.7 % United States 1.9 % 3.5 % 2.6 % 2.9 % 1.9 % 4.6 % Consumer Prices Interest Rates Data table Consumer Prices Interest Rates Forecast 3-month 1-yr Govt Country Year Ago Latest 2015e Latest Latest Australia 4.9 % 2.3 % 2.6 % 6.99 % 6.25 % 0.8 % -0.1 % 0.0 % 0.59 % 1.69 % Japan United States 2.9 % 2.8 % 2.5 % 4.63 % 4.54 % Trade Balance Current Account Current Units (per US$) Last 12 mos Last 12 mos Forecast 15 Country (billion $) (billion $) (% of GDP) Oct 17th Year Ago Australia -13.3 -46.8 -5.7 % 1.13 1.33 - Data table United States 2.9 % 2.8 % 2.5 % 4.63 % 4.54 % Trade Balance Current Account Current Units (per US$) Last 12 mos Last 12 mos Forecast 15 Country (billion $) (billion $) (% of GDP) Oct 17th Year Ago Australia -13.3 -46.8 -5.7 % 1.13 1.33 Japan 98.4 197.3 4.6 % 117.00 121.00 United States -810.4 -793.7 -5.7 % 1.00 1.00 Note: Unless otherwise noted, percentages are percentage changes over one year. Rec Qtr = recent quarter. Values for 2015e are estimates or forecasts
Step by Step Solution
There are 3 Steps involved in it

Get step-by-step solutions from verified subject matter experts