

Question: PLEASE ANSWER ALL 3 QUESTIONS!!! 1. Use the cylinder function to create x , y , and z matrices and pass them to the surf
PLEASE ANSWER ALL 3 QUESTIONS!!!
1. Use the cylinder function to create x, y, and z matrices and pass them to the surf function to get a surface plot. Experiment with different arguments to cylinder.
2. Create an x vector that has 30 linearly spaced points in the range from -2 pi to 2 pi, and then y as sin(x). Do a stem plot of these points, and store the handle in a variable. Use get to see the properties of the stem plot, and then set to change the face color of the marker.
3.
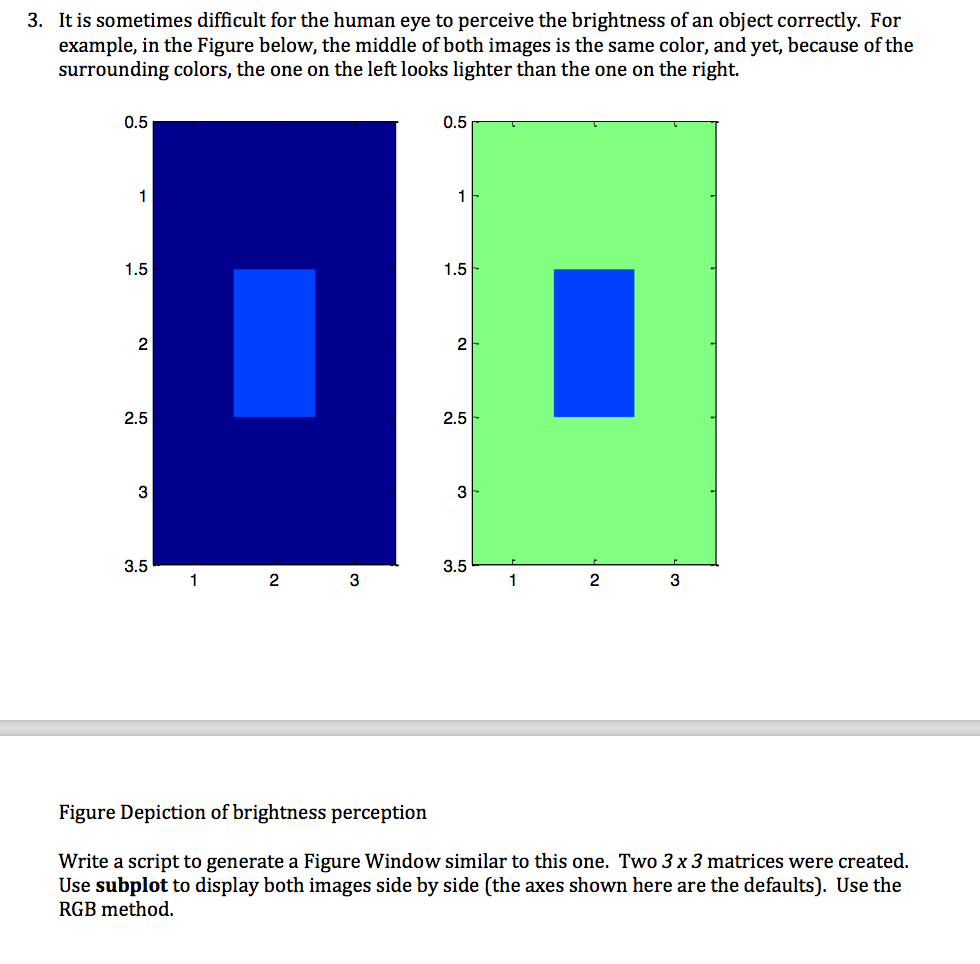
It is sometimes difficult for the human eye to perceive the brightness of an object correctly. For example, in the Figure below, the middle of both images is the same color, and yet, because of the surrounding colors, the one on the left looks lighter than the one on the right 3. 0.5 0.5 1.5 1.5 2 2 2.5 2.5 3.5 3.5 2 3 2 Figure Depiction of brightness perception Write a script to generate a Figure Window similar to this one. Two 3 x 3 matrices were created. Use subplot to display both images side by side (the axes shown here are the defaults). Use the RGB method
Step by Step Solution
There are 3 Steps involved in it

Get step-by-step solutions from verified subject matter experts