

Question: Please answer all parts, show full codes along with output and share the pictures of the jupyter notebook answering all questions: 1. Write a Jupiter
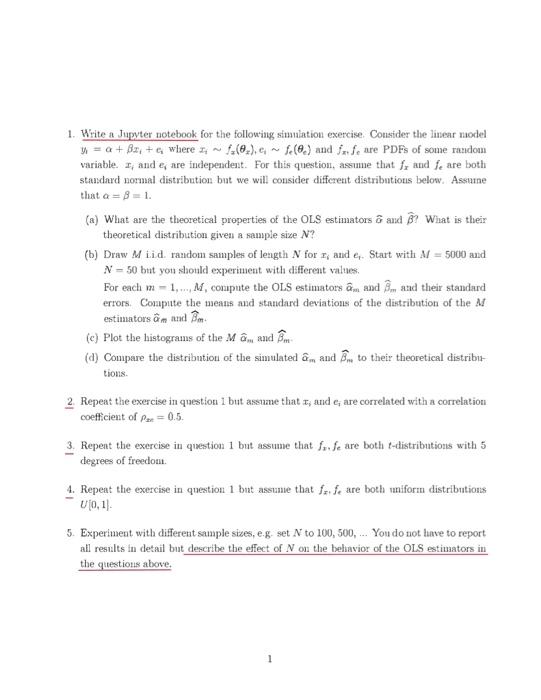
1. Write a Jupiter notebook for the following simulation exercise. Consider the linear model 9 = a + Bxr + where 4 ~ 1.10.), fe() and fx fe are PDFs of some random variable. I, and e, are independent. For this question, assume that f, and fe are both standard normal distribution but we will consider different distributions below. Assunne that a = 3 = 1 (a) What are the theoretical properties of the OLS estimators & and B? What is their theoretical distribution given a sample size N? (b) Draw M tid. random samples of length N for sand & Start with M = 5000 and N = 50 bit you should experiment with different values For each m - 1,... M, compute the OLS estimators m and and their standard errors. Compite the meats and standard deviations of the distribution of the estimators m and Bom (e) Plot the histograms of the Man and (a) Compare the distribution of the simulated m and to their theoretical distribut tions 2. Repeat the exercise in question 1 but assume that I, and are correlated with a correlation coefficient of Per=0.5 3. Repent the exercise in question 1 but assume that fe are both e-distributions with 5 degrees of freedom 4. Repeat the exercise in question 1 buat assume that fe fe are both uniform distributions U10,11 5. Experiment with different sample sizes, eg set N to 100, 500, ... You do not have to report all results in detail but describe the effect of N on the behavior of the OLS estimators in the questions above 1. Write a Jupiter notebook for the following simulation exercise. Consider the linear model 9 = a + Bxr + where 4 ~ 1.10.), fe() and fx fe are PDFs of some random variable. I, and e, are independent. For this question, assume that f, and fe are both standard normal distribution but we will consider different distributions below. Assunne that a = 3 = 1 (a) What are the theoretical properties of the OLS estimators & and B? What is their theoretical distribution given a sample size N? (b) Draw M tid. random samples of length N for sand & Start with M = 5000 and N = 50 bit you should experiment with different values For each m - 1,... M, compute the OLS estimators m and and their standard errors. Compite the meats and standard deviations of the distribution of the estimators m and Bom (e) Plot the histograms of the Man and (a) Compare the distribution of the simulated m and to their theoretical distribut tions 2. Repeat the exercise in question 1 but assume that I, and are correlated with a correlation coefficient of Per=0.5 3. Repent the exercise in question 1 but assume that fe are both e-distributions with 5 degrees of freedom 4. Repeat the exercise in question 1 buat assume that fe fe are both uniform distributions U10,11 5. Experiment with different sample sizes, eg set N to 100, 500, ... You do not have to report all results in detail but describe the effect of N on the behavior of the OLS estimators in the questions above
Step by Step Solution
There are 3 Steps involved in it

Get step-by-step solutions from verified subject matter experts