

Question: Please answer all parts The table below gives data on moisture content for specimens of a certain type of fabric. Sample No. Moisture-Content Observations X
Please answer all parts
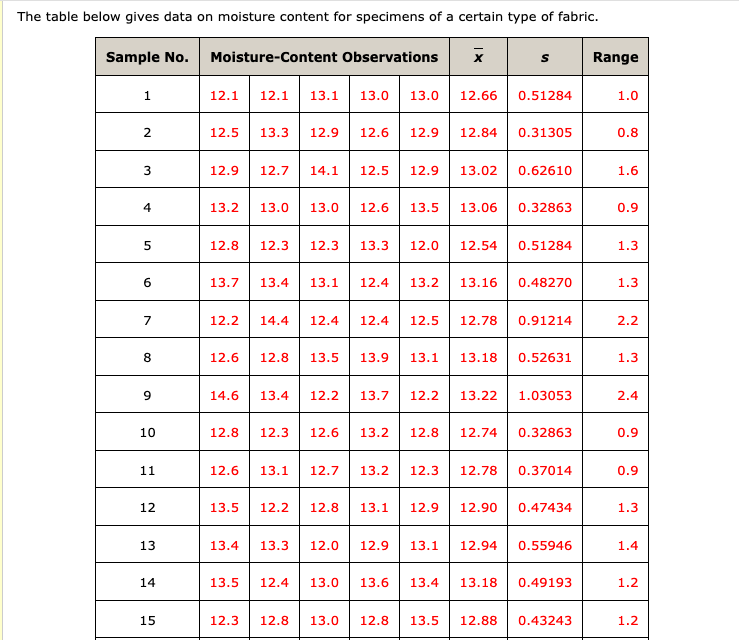
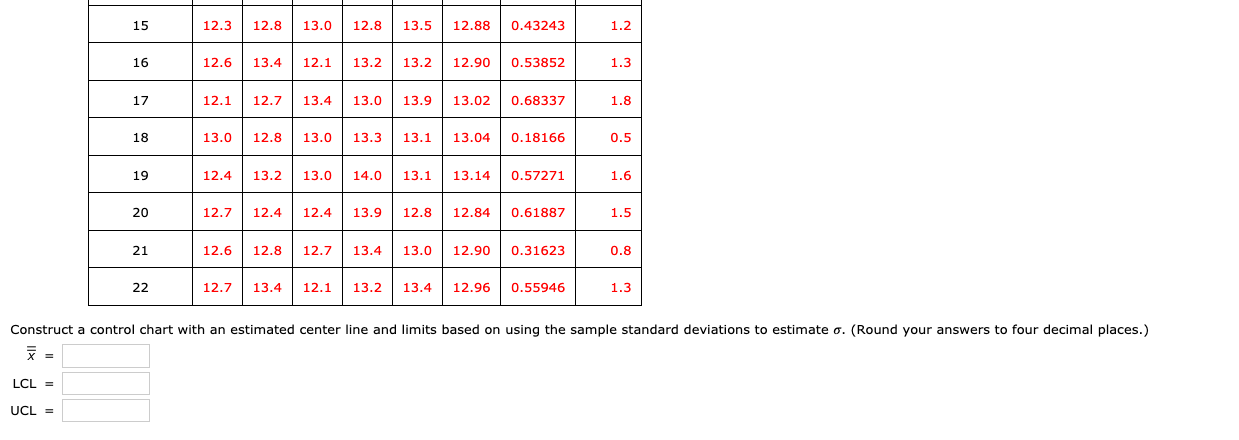
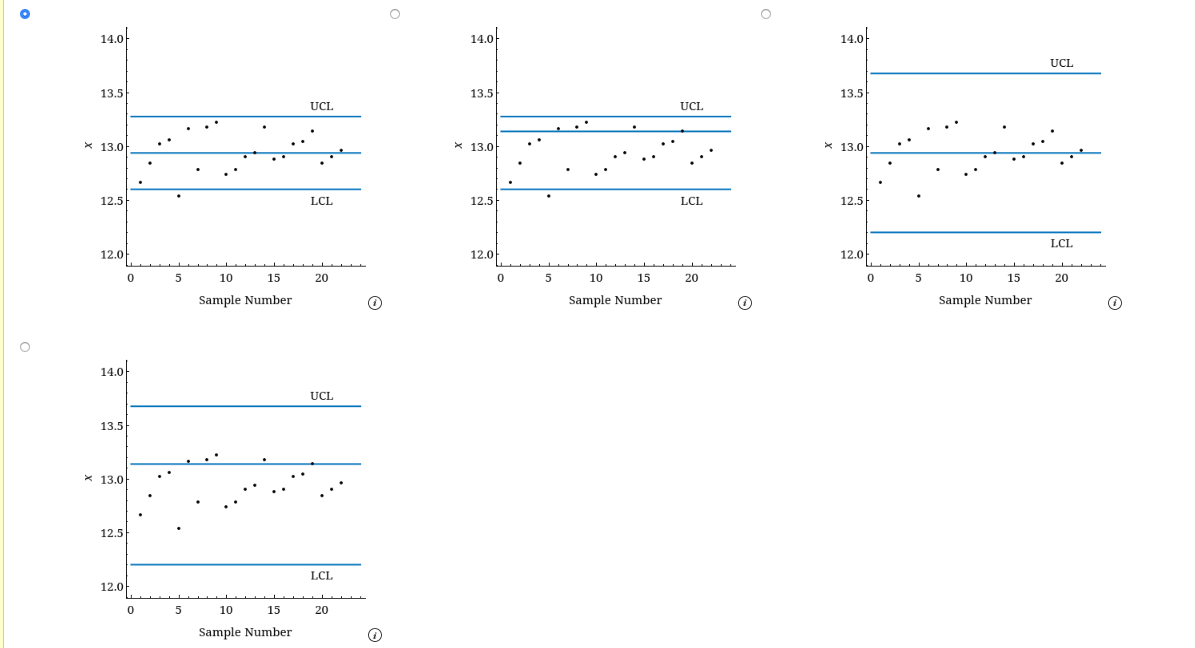
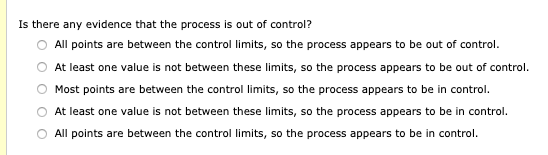
The table below gives data on moisture content for specimens of a certain type of fabric. Sample No. Moisture-Content Observations X S Range 12.1 12.1 13.1 13.0 13.0 12.66 0.51284 1.0 2 12.5 13.3 12.9 12.6 12.9 12.84 0.31305 .8 3 12.9 12.7 14.1 12.5 12.9 13.02 0.62610 1.6 4 13.2 13.0 13.0 12.6 13.5 13.06 0.32863 0.9 5 12.8 12.3 12.3 13.3 12.0 12.54 0.51284 1.3 6 13.7 13.4 13.1 12.4 13.2 13.16 0.48270 1.3 7 12.2 14.4 12.4 12.4 12.5 12.78 0.91214 2.2 8 12.6 12.8 13.5 13.9 13.1 13.18 0.52631 1.3 9 14.6 13.4 12.2 13.7 12.2 13.22 1.03053 2.4 10 12.8 12.3 12.6 13.2 12.8 12.74 0.32863 0.9 11 12.6 13.1 12.7 13.2 12.3 12.78 0.37014 0.9 12 13.5 12.2 12.8 13.1 12.9 12.90 0.47434 1.3 13 13.4 13.3 12.0 12.9 13.1 12.94 0.55946 1.4 14 13.5 12.4 13.0 13.6 13.4 13.18 0.49193 1.2 15 12.3 12.8 13.0 12.8 13.5 12.88 0.43243 1.215 12.3 12.8 13.0 12.8 13.5 12.88 0.43243 1.2 16 12.6 13.4 12.1 13.2 13.2 12.90 0.53852 1.3 17 12.1 12.7 13.4 13.0 13.9 13.02 0.68337 1.8 18 13.0 12.8 13.0 13.3 13.1 13.04 0.18166 0.5 19 12.4 13.2 13.0 14.0 13.1 13.14 0.57271 1.6 20 12.7 12.4 12.4 13.9 12.8 12.84 0.61887 1.5 21 12.6 12.8 12.7 13.4 13.0 12.90 0.31623 0.8 22 12.7 13.4 12.1 13.2 13.4 12.96 0.55946 1.3 Construct a control chart with an estimated center line and limits based on using the sample standard deviations to estimate o. (Round your answers to four decimal places.) X = LCL = UCL =O O O 140. 14.0 14.0 UCL 13.5 13.5 UCL 13.5 UCL * 13.0 * 13.0 * 13.0 12.5 LCL 12.5 LCL 12.5 12.0 12.0 LCL 12.0 0 5 10 15 20 0 5 10 15 20 0 5 10 15 Sample Number 20 Sample Number Sample Number O O 14.0/ UCL 13.5 * 13.0 12.5 12.0 LCL 5 10 15 20 Sample NumberIs there any evidence that the process is out of control? O All points are between the control limits, so the process appears to be out of control. O At least one value is not between these limits, so the process appears to be out of control. O Most points are between the control limits, so the process appears to be in control. O At least one value is not between these limits, so the process appears to be in control. O All points are between the control limits, so the process appears to be in control
Step by Step Solution
There are 3 Steps involved in it

Get step-by-step solutions from verified subject matter experts