

Question: Statistics and Probability The table below gives data on moisture content for specimens of a certain type of fabric. Copy the data into R to
Statistics and Probability
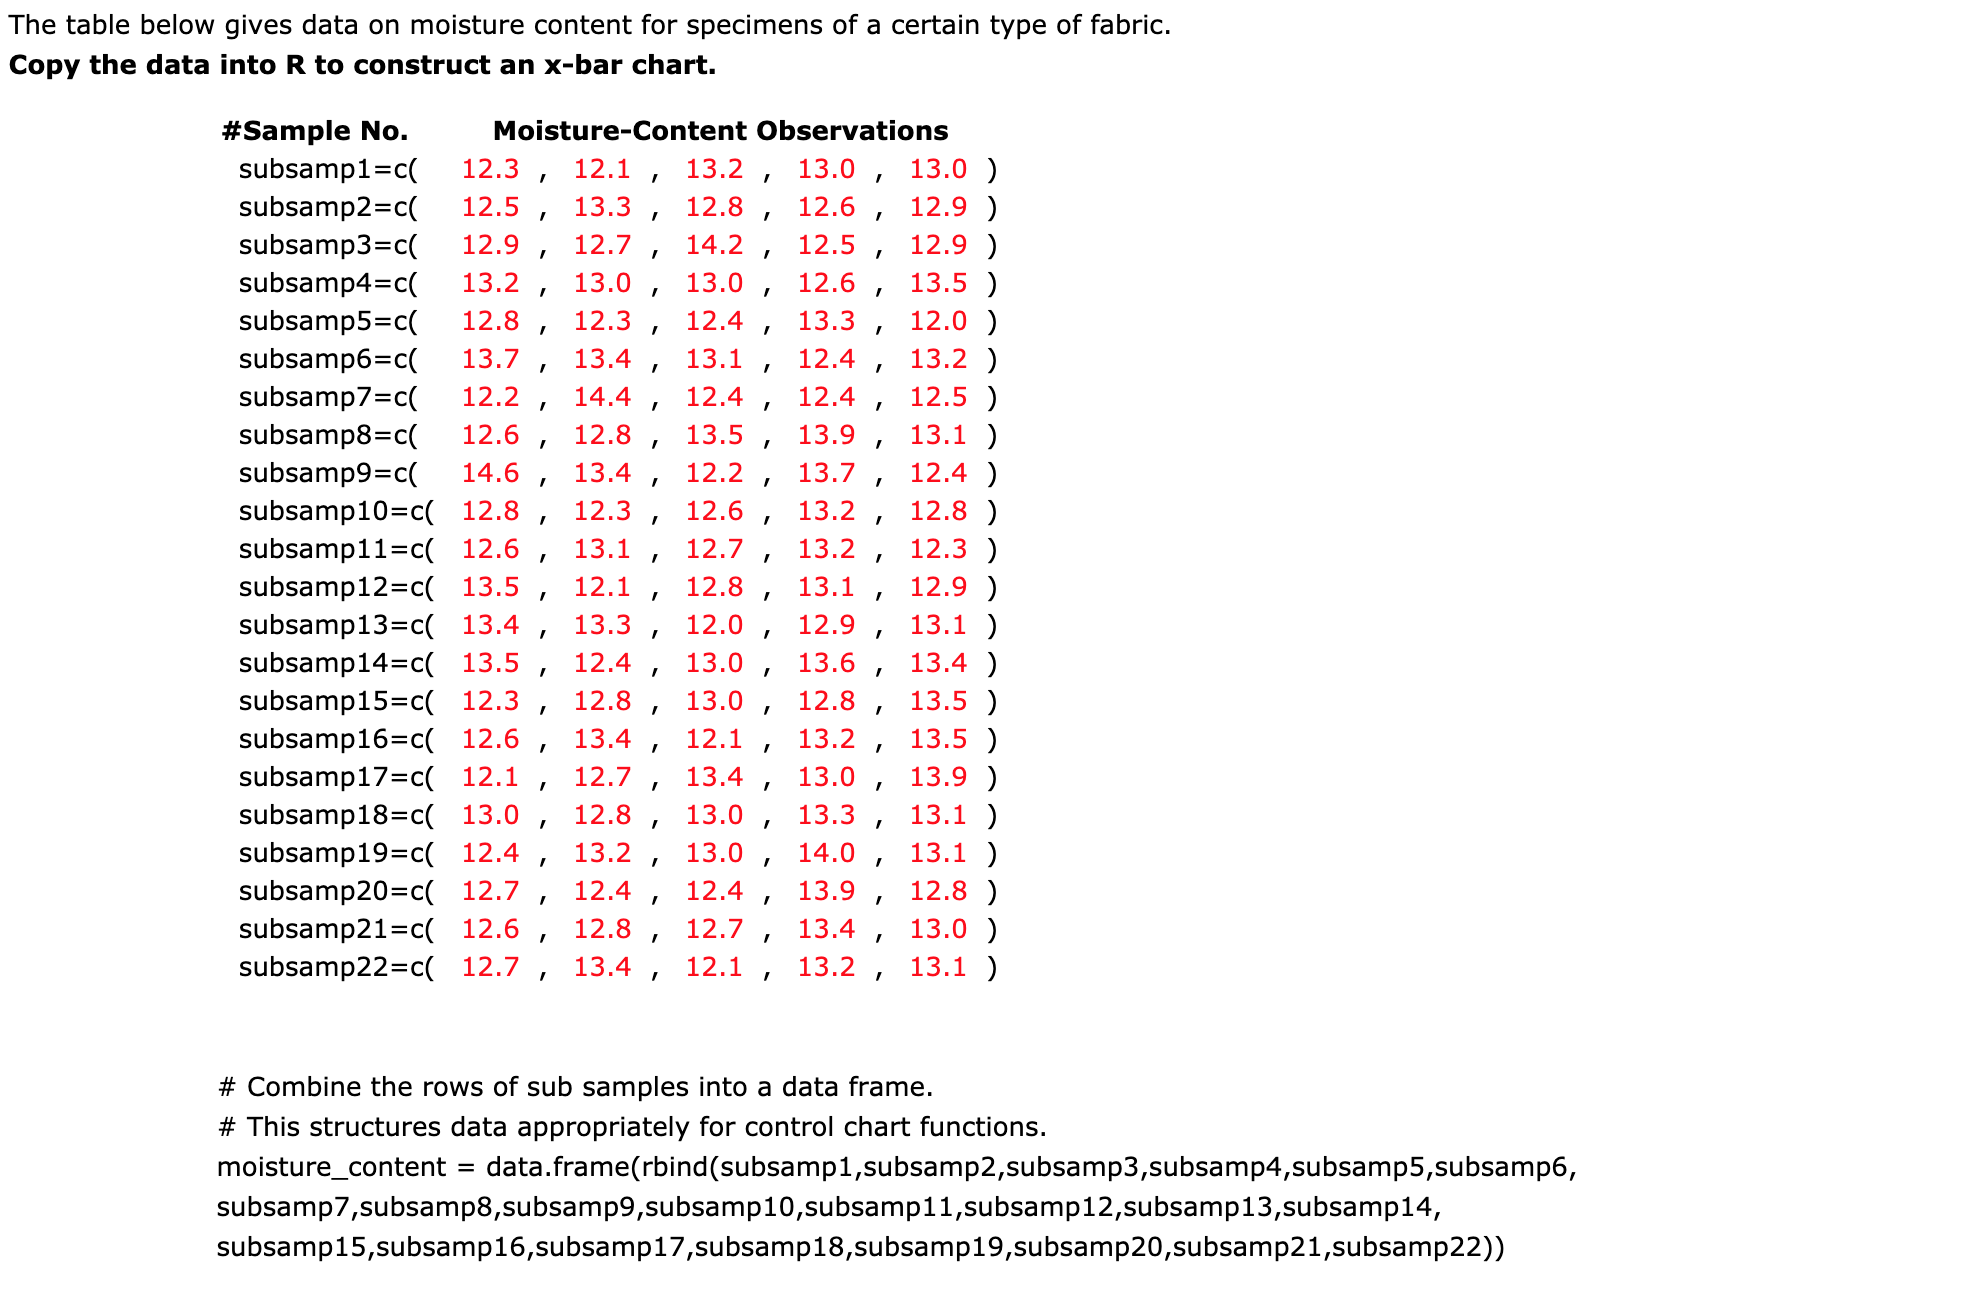
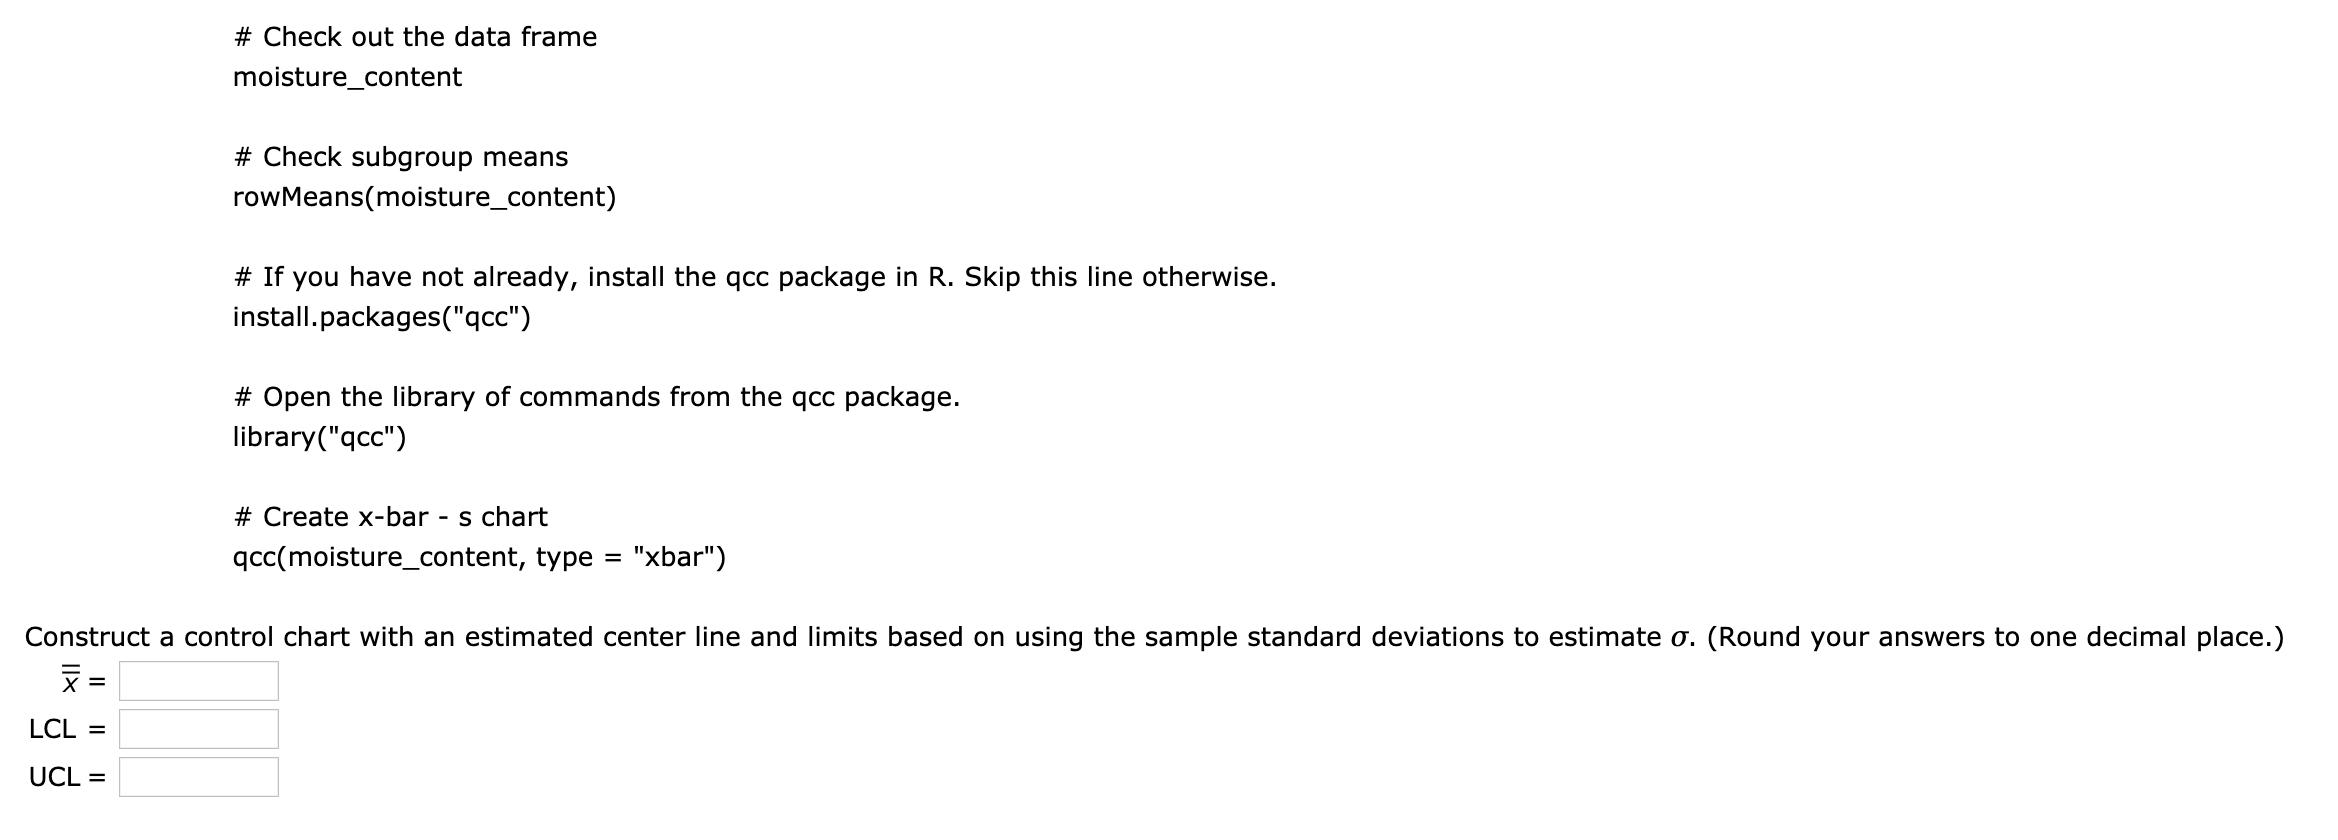
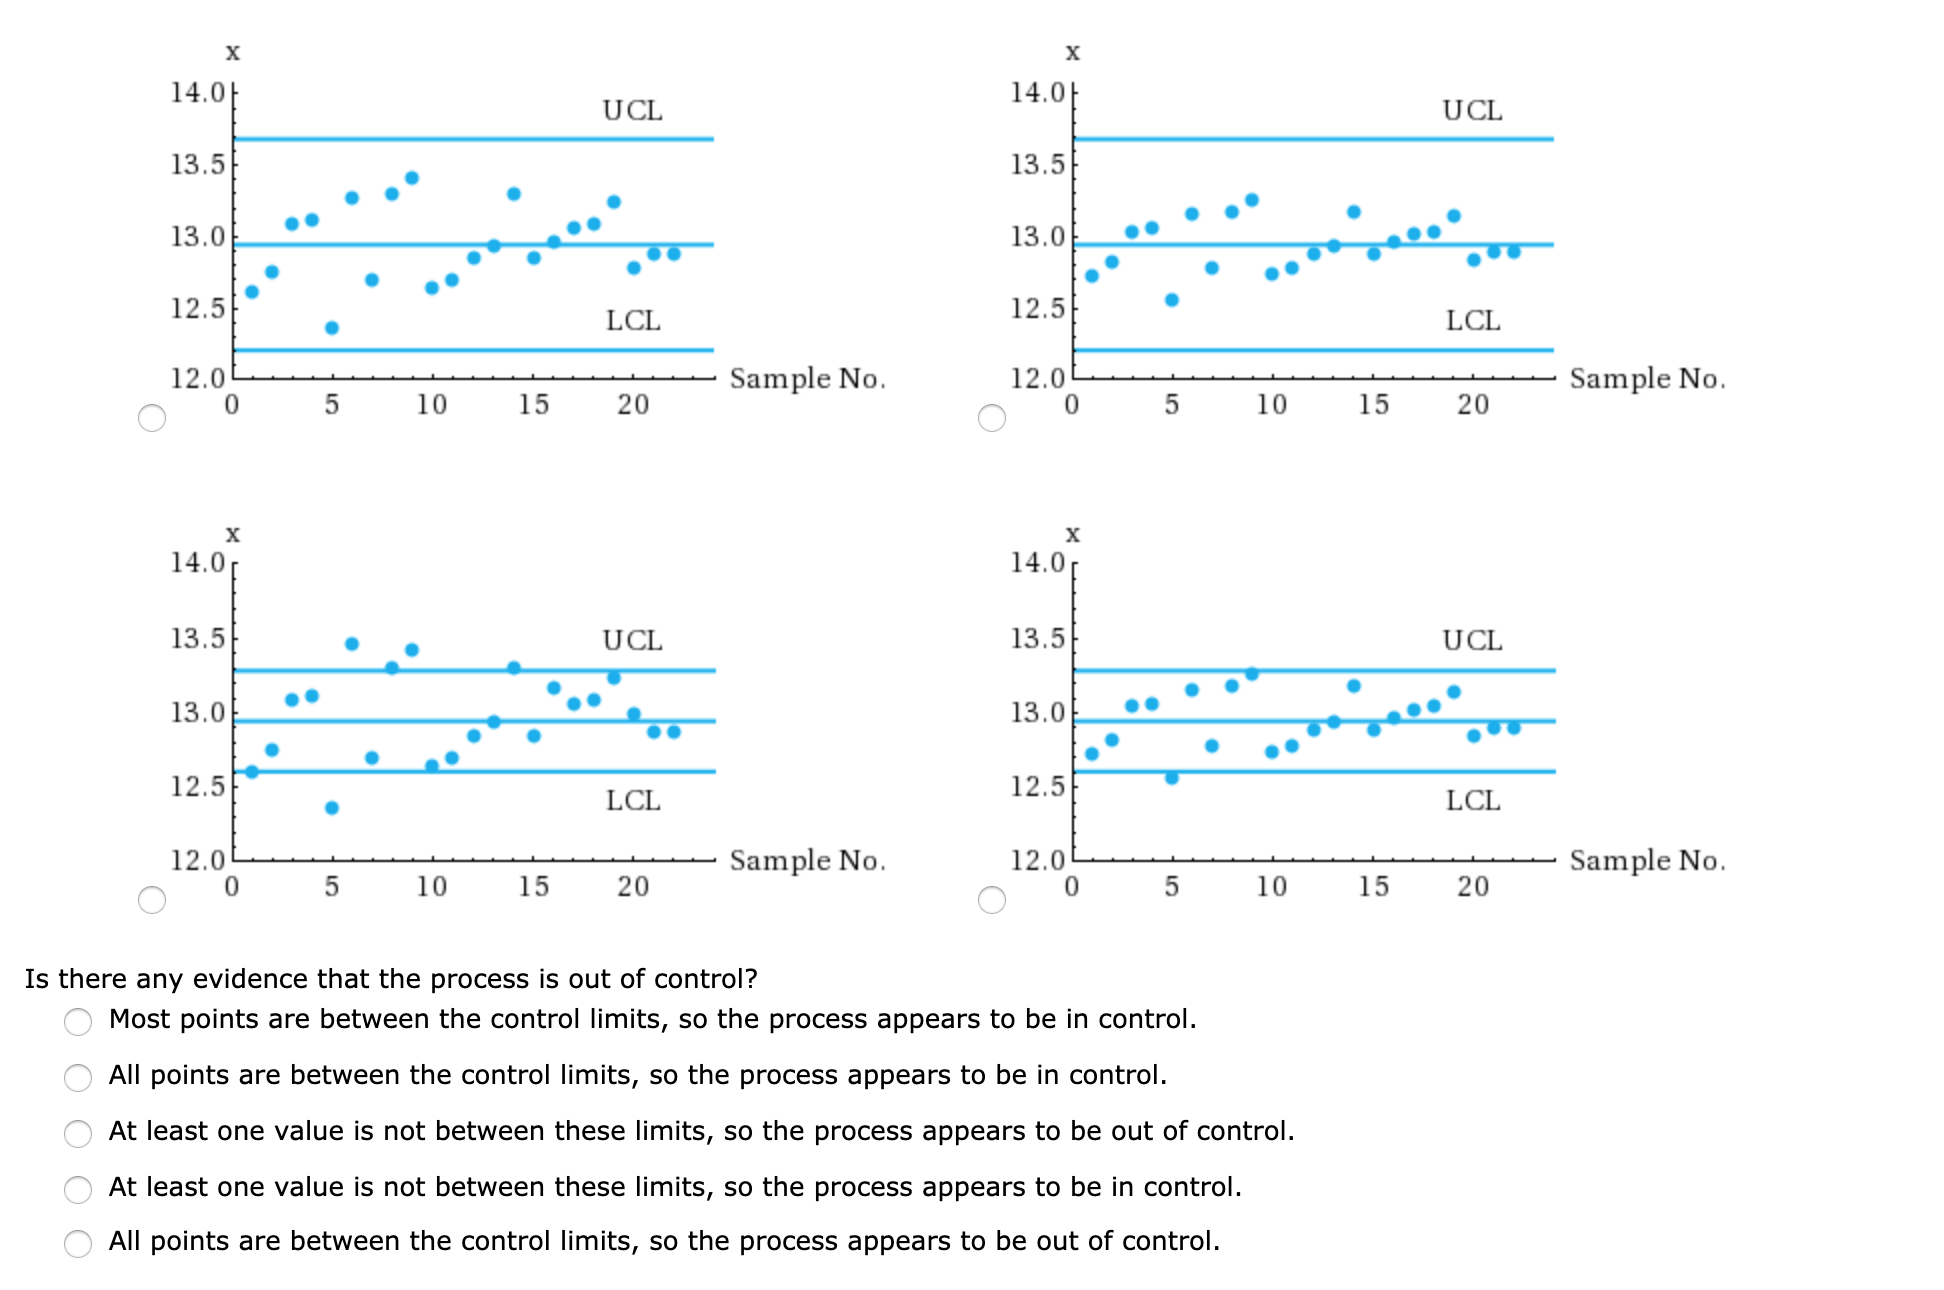
The table below gives data on moisture content for specimens of a certain type of fabric. Copy the data into R to construct an x-bar chart. #Sample No. Moisture-Content Observations subsamp1=c( 12.3 , 12.1 , 13.2 , 13.0 , 13.0 ) subsamp2=c( 12.5 , 13.3 , 12.8 , 12.6 , 12.9 ) subsamp3=c( 12.9 , 12.7 , 14.2 , 12.5 , 12.9 ) subsamp4=c( 13.2 , 13.0 , 13.0 , 12.6 , 13.5 ) subsamp5=c( 12.8 , 12.3 , 12.4 , 13.3 , 12.0 ) subsamp6=c( 13.7 , 13.4 , 13.1 , 12.4 , 13.2 ) subsamp7=c( 12.2 , 14.4 , 12.4 , 12.4 , 12.5 ) subsamp8=c( 12.6 , 12.8 , 13.5 , 13.9 , 13.1 ) subsamp9=c( 14.6 , 13.4 , 12.2 , 13.7 , 12.4 ) subsamp10=c( 12.8 , 12.3 , 12.6 , 13.2 , 12.8 ) subsamp11=c( 12.6 , 13.1 , 12.7 , 13.2 , 12.3 ) subsamp12=c( 13.5 , 12.1 , 12.8 , 13.1 , 12.9 ) subsamp13=c( 13.4 , 13.3 , 12.0 , 12.9 , 13.1 ) subsamp14=c( 13.5 , 12.4 , 13.0 , 13.6 , 13.4 ) subsamp15=c( 12.3 , 12.8 , 13.0 , 12.8 , 13.5 ) subsamp16=c( 12.6 , 13.4 , 12.1 , 13.2 , 13.5 ) subsamp17=c( 12.1 , 12.7 , 13.4 , 13.0 , 13.9 ) subsamp18=c( 13.0 , 12.8 , 13.0 , 13.3 , 13.1 ) subsamp19=c( 12.4 , 13.2 , 13.0 , 14.0 , 13.1 ) subsamp20=c( 12.7 , 12.4 , 12.4 , 13.9 , 12.8 ) subsamp21=c( 12.6 , 12.8 , 12.7 , 13.4 , 13.0 ) subsamp22=c( 12.7 , 13.4 , 12.1 , 13.2 , 13.1 ) # Combine the rows of sub samples into a data frame. # This structures data appropriately for control chart functions. moisture_content = data.frame(rbind(subsamp1, subsamp2,subsamp3, subsamp4, subsamp5, subsamp6, subsamp7, subsamp8, subsamp9,subsamp10,subsamp11, subsamp12,subsamp13, subsamp14, subsamp15,subsamp16,subsamp17,subsamp18,subsamp19,subsamp20,subsamp21,subsamp22))# Check out the data frame moisture_content # Check subgroup means rowMeans(moisture_content) # If you have not already, install the qcc package in R. Skip this line otherwise. install.packages("qcc") # Open the library of commands from the qcc package. library("qcc") # Create x-bar - s chart qcc(moisture_content, type = "xbar") Construct a control chart with an estimated center line and limits based on using the sample standard deviations to estimate o. (Round your answers to one decimal place.) X = LCL = UCL =Sample No. Sample No. Sample No. Is there any evidence that the process is out of control? A Most points are between the control limits, so the process appears to be in control. All points are between the control limits, so the process appears to be in control. / \\ ' D At least one value is not between these limits, so the process appears to be out of control. / I x 0 At least one value is not between these limits, so the process appears to be in control. All points are between the control limits, so the process appears to be out of control. ( x
Step by Step Solution
There are 3 Steps involved in it

Get step-by-step solutions from verified subject matter experts