

Question: please answer all parts, will upvote upon completion Refer to Table S6 1 - Factors for Computing Control Chart Limits (3 sigma) for this problem.
please answer all parts, will upvote upon completion 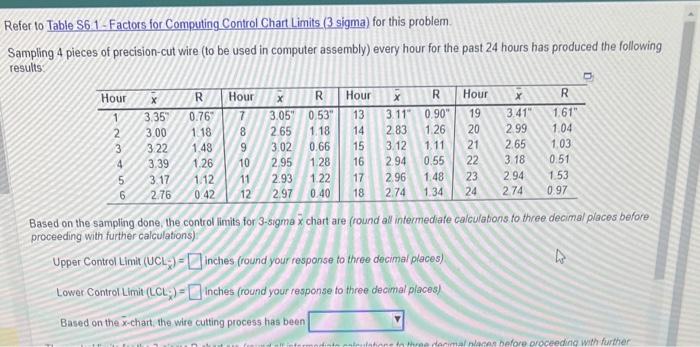
Refer to Table S6 1 - Factors for Computing Control Chart Limits (3 sigma) for this problem. Sampling 4 pieces of precision-cut wire (to be used in computer assembly) every hour for the past 24 hours has produced the following results? Based on the sampling done, the control limits for 3 -sigme x chart are (round all intermediale calculations to three decimal places before proceeding with further calculations): Upper Control Limit (UCLx)= inches (round your response to three decimal places) Lower Control Limit (LCLx)= inches (round your response to three decimal places) Based on the x-chart, the wire cutting process has been mits for 3 -sigma x es (round your res) IN CONTROL hes (round your resk OUT OF CONTROL g process has been It are (round all intermediate calculations to three decimal places before
Step by Step Solution
There are 3 Steps involved in it
1 Expert Approved Answer
Step: 1 Unlock

Question Has Been Solved by an Expert!
Get step-by-step solutions from verified subject matter experts
Step: 2 Unlock
Step: 3 Unlock