

Question: please answer all questions 4. We are interested in the effect on test scores of the student-teacher ratio (STR). The following regression results have been
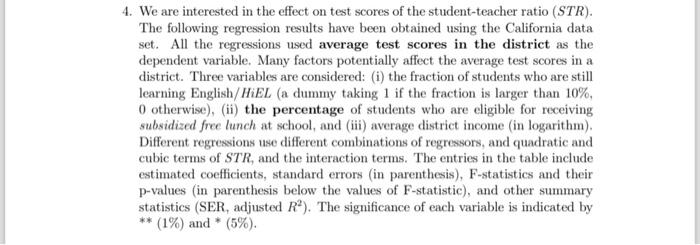
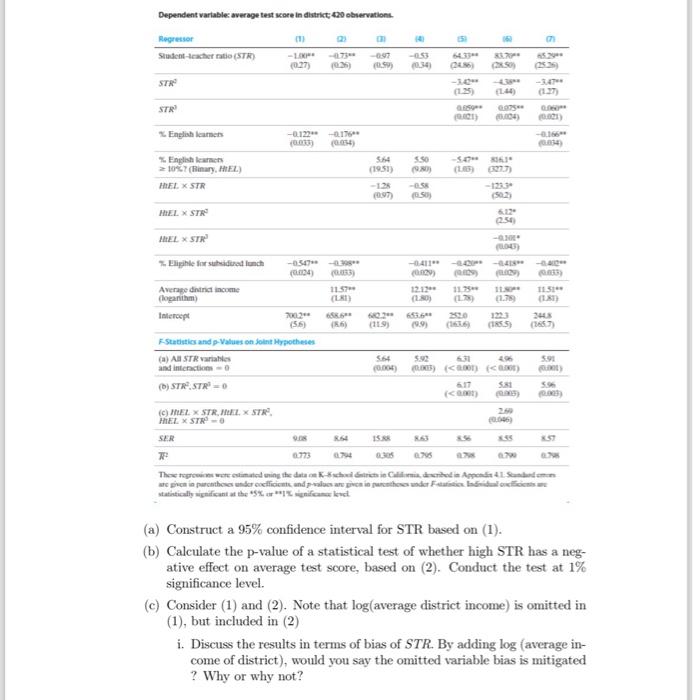
4. We are interested in the effect on test scores of the student-teacher ratio (STR). The following regression results have been obtained using the California data set. All the regressions used average test scores in the district as the dependent variable. Many factors potentially affect the average test scores in a district. Three variables are considered: (i) the fraction of students who are still learning English/HiEL (a dummy taking 1 if the fraction is larger than 10%, 0 otherwise), (ii) the percentage of students who are eligible for receiving subsidized free lunch at school, and (iii) average district income (in logarithm). Different regressions use different combinations of regressors, and quadratic and cubic terms of STR, and the interaction terms. The entries in the table include estimated coefficients, standard errors (in parenthesis), F-statistics and their p-values (in parenthesis below the values of F-statistic), and other summary statistics (SER, adjusted R2 ). The significance of each variable is indicated by ** (1%) and * (5%). (a) Construct a 95\% confidence interval for STR based on (1). (b) Calculate the p-value of a statistical test of whether high STR has a negative effect on average test score, based on (2). Conduct the test at 1% significance level. (c) Consider (1) and (2). Note that log (average district income) is omitted in (1), but included in (2) i. Discuss the results in terms of bias of STR. By adding log (average income of district), would you say the omitted variable bias is mitigated ? Why or why not
Step by Step Solution
There are 3 Steps involved in it

Get step-by-step solutions from verified subject matter experts