

Question: PLEASE ANSWER ALL QUESTIONS AND EXCEL I NEED HELP Jays Bikes is a family-owned and -operated business that stocks a wide range of bikes designed
 PLEASE ANSWER ALL QUESTIONS AND EXCEL I NEED HELP\
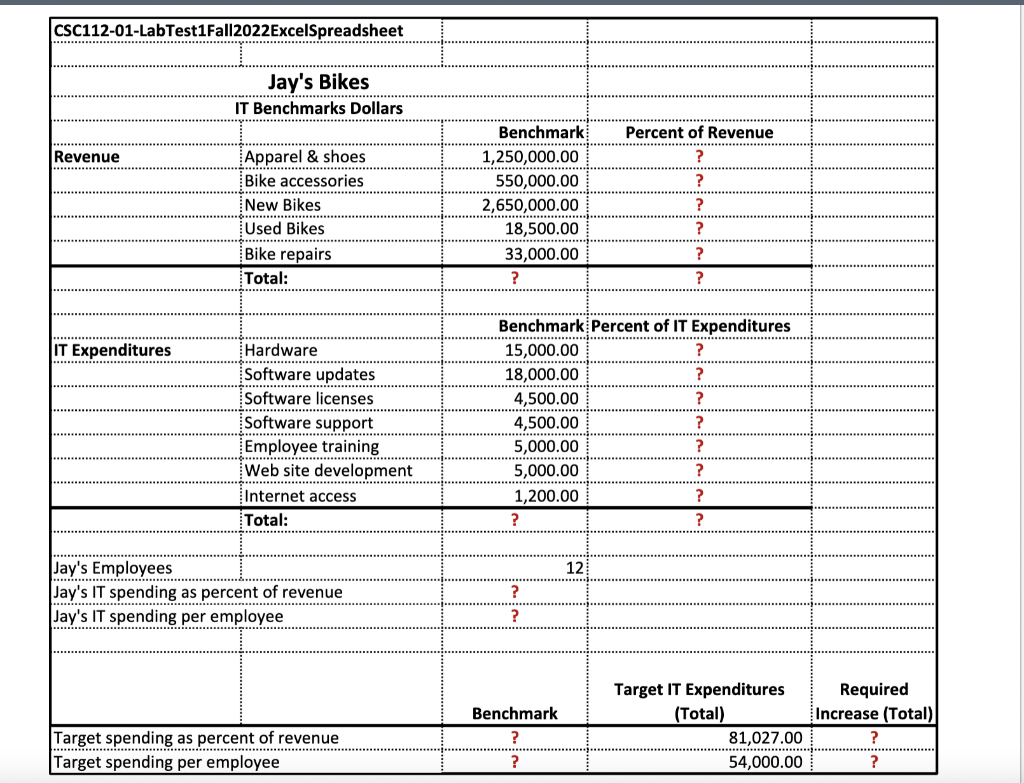
Jays Bikes is a family-owned and -operated business that stocks a wide range of bikes designed to fit the needs of professional riders, your childs first bike, and everything in between. The business has 12 full-time employees. Jay has asked you to create a spreadsheet from the data in Figure 2-21to calculate average IT spending so that it can be compared to the retail industry average. What is the average IT spending in the retail industry? What is the average IT spending per employee in the retail industry? How do Jays IT expenditures compare to the industry averages? How much would Jay need to increase spending in order to match the retail industry average?
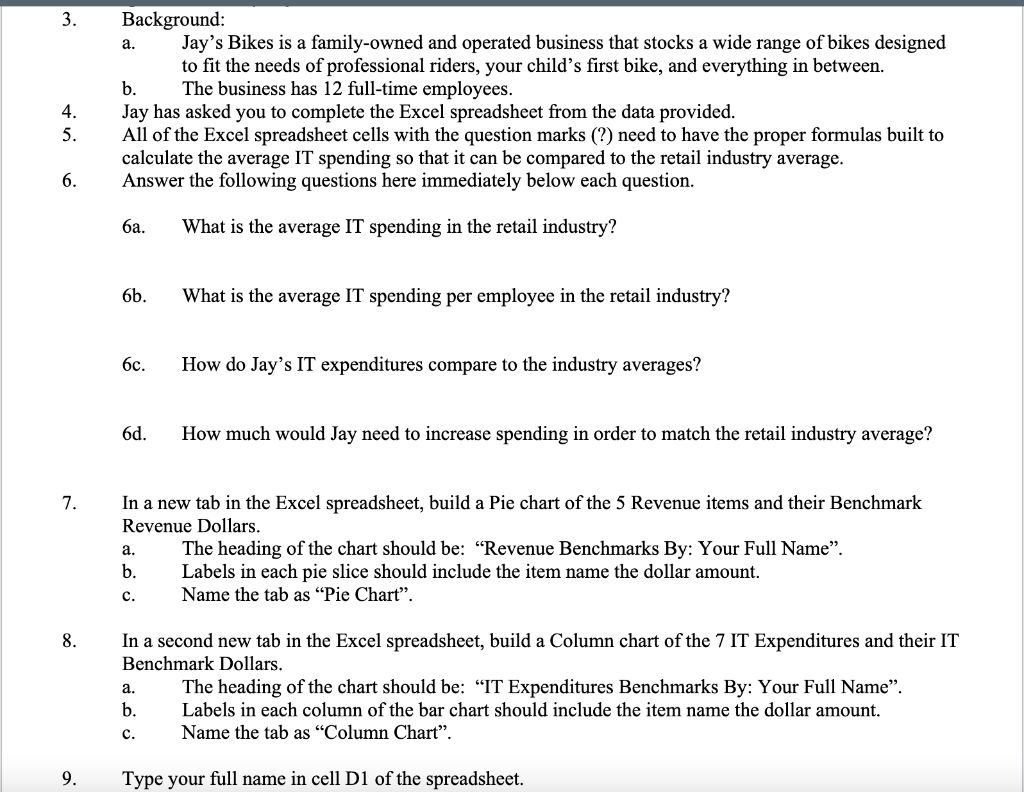
3. Background: a. Jay's Bikes is a family-owned and operated business that stocks a wide range of bikes designed to fit the needs of professional riders, your child's first bike, and everything in between. b. The business has 12 full-time employees. 4. Jay has asked you to complete the Excel spreadsheet from the data provided. 5. All of the Excel spreadsheet cells with the question marks (?) need to have the proper formulas built to calculate the average IT spending so that it can be compared to the retail industry average. 6. Answer the following questions here immediately below each question. 6a. What is the average IT spending in the retail industry? 6b. What is the average IT spending per employee in the retail industry? 6c. How do Jay's IT expenditures compare to the industry averages? 6d. How much would Jay need to increase spending in order to match the retail industry average? 7. In a new tab in the Excel spreadsheet, build a Pie chart of the 5 Revenue items and their Benchmark Revenue Dollars. a. The heading of the chart should be: "Revenue Benchmarks By: Your Full Name". b. Labels in each pie slice should include the item name the dollar amount. c. Name the tab as "Pie Chart". 8. In a second new tab in the Excel spreadsheet, build a Column chart of the 7 IT Expenditures and their IT Benchmark Dollars. a. The heading of the chart should be: "IT Expenditures Benchmarks By: Your Full Name". b. Labels in each column of the bar chart should include the item name the dollar amount. c. Name the tab as "Column Chart". 9. Type your full name in cell D1 of the spreadsheetStep by Step Solution
There are 3 Steps involved in it

Get step-by-step solutions from verified subject matter experts