

Question: Please answer all questions! I have attached the Excel file below. Thank you f7. [-/5 Points] DETAILS MY NOTES The SAT and ACT are the
Please answer all questions! I have attached the Excel file below. Thank you
![you \f7. [-/5 Points] DETAILS MY NOTES The SAT and ACT are](https://dsd5zvtm8ll6.cloudfront.net/si.experts.images/questions/2024/11/672aea4d4b5dd_740672aea4d00112.jpg)
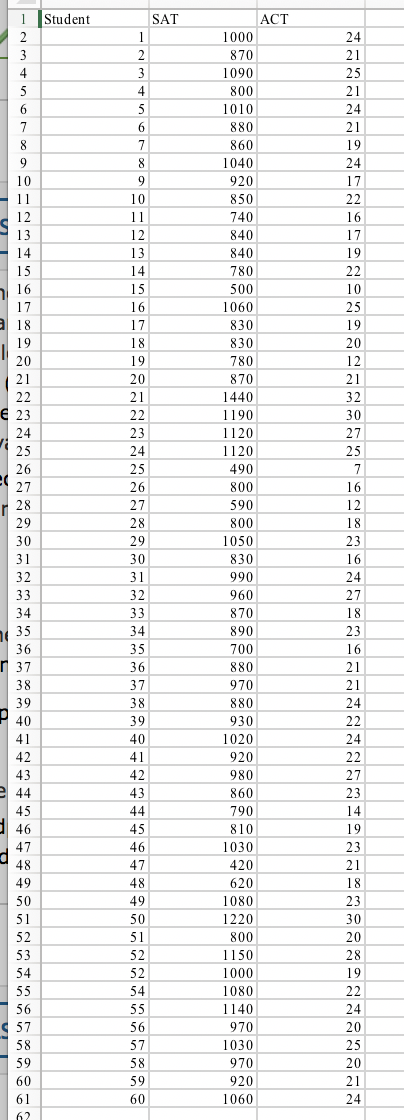
\f7. [-/5 Points] DETAILS MY NOTES The SAT and ACT are the two major standardized tests that colleges use to evaluate applicants. Most students take just one of these tests. However, some students take both. This Excel file gives the scores of 60 students who took both tests. Can we relate the two tests? Plot the data with SAT on the x axis and ACT on the y axis and answer the questions below. Question 1. Find the slope and intercept of the least squares regression line (draw the least squares line on your plot). intercept (use 4 decimal places) slope (use 4 decimal places) Question 2. Give the value of the test statistic for a test of Ho: B1 = 0. (use 4 decimal places) Question 3. If the alternative hypothesis is Ha: B1 # 0, what is the rejection region if the significance level of the test is a = .05? Use this t-table to determine your answer. ts t 2 Question 4. What is the correct conclusion for this hypothesis test? Do not reject the null hypothesis Ho; the SAT score is not useful for predicting the ACT score. Reject the null hypothesis Ho and conclude that in a linear model SAT score is useful for predicting the ACT score. Question 5. Determine a 95% confidence interval for the slope , of the least squares line (use 3 decimal places in your answers; use this t-table to determine the correct t-value). lower endpoint of confidence interval upper endpoint of confidence interval
Step by Step Solution
There are 3 Steps involved in it

Get step-by-step solutions from verified subject matter experts