Question: Please answer all questions in Excel with formulas to setup! My random generated numbers will be different when time to Simulate. Problem 6 The time

Please answer all questions in Excel with formulas to setup! My random generated numbers will be different when time to Simulate. Please answer all questions in Excel with
Problem 6 The time between arrivals at a drive-through window of a fast-food restaurant follows the distribution given below. The service time distribution is also given in the table below. Use the random numbers provided to simulate the activity of the first five arrivals. Assume that the window opens at 11:00 am and the first arrival after this is based on the first interarrival time generated. Service Time Probability 0.2 Time Between Arrivals 1 2 3 4 Probability 0.3 0.5 0.2 1 2 3 0.3 0.3 0.2 Simulate 100 customers using the probability distribution above, and answer the following: 1. What is the average wait time? 2. What is the average service time? 3. What times does the fourth customer leave the system? The 25 4. How many customers had to wait? 5. How much is idle time? 6. Change the probability distribution so that the time between arrivals follows an exponential distribution with a mean time between arrivals of 2.5 minutes. a. What do you observe in your simulations? Why

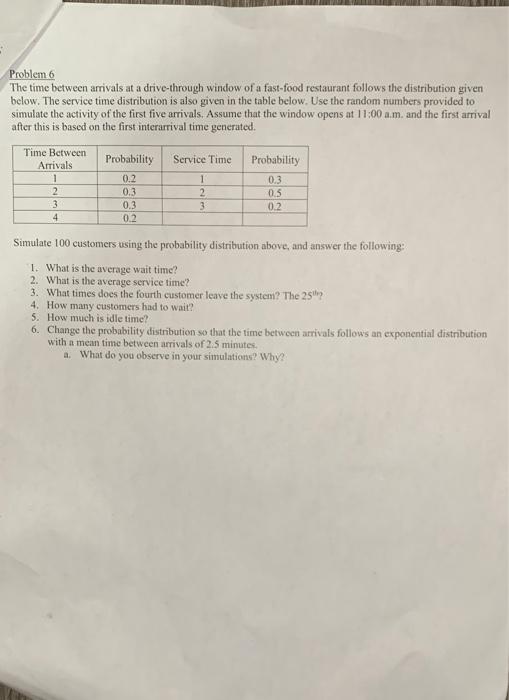
Step by Step Solution

There are 3 Steps involved in it

1 Expert Approved Answer
Step: 1 Unlock blur-text-image
Question Has Been Solved by an Expert!

Get step-by-step solutions from verified subject matter experts

Step: 2 Unlock
Step: 3 Unlock

Students Have Also Explored These Related General Management Questions!