

Question: please answer all questions Problem 1(4 pts): The following values of X and R were obtained from samples of 5 items taken each hour. (a).
please answer all questions 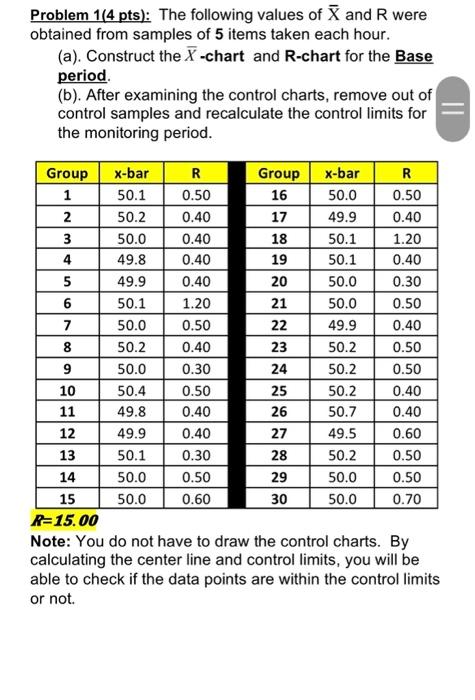
Problem 1(4 pts): The following values of X and R were obtained from samples of 5 items taken each hour. (a). Construct the X-chart and R-chart for the Base period. (b). After examining the control charts, remove out of control samples and recalculate the control limits for the monitoring period. n=10UU Note: You do not have to draw the control charts. By calculating the center line and control limits, you will be able to check if the data points are within the control limits or not
Step by Step Solution
There are 3 Steps involved in it
1 Expert Approved Answer
Step: 1 Unlock

Question Has Been Solved by an Expert!
Get step-by-step solutions from verified subject matter experts
Step: 2 Unlock
Step: 3 Unlock