

Question: Please answer all the question. QUESTION 3 Perform appropriate analysis: Exercise 8-2; Question 12, page 436 from textbook by A.G Bluman, Elementary Statistics: A step
Please answer all the question.
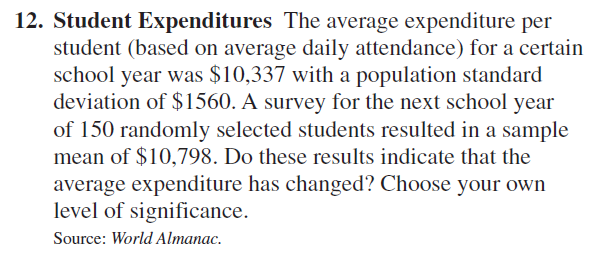
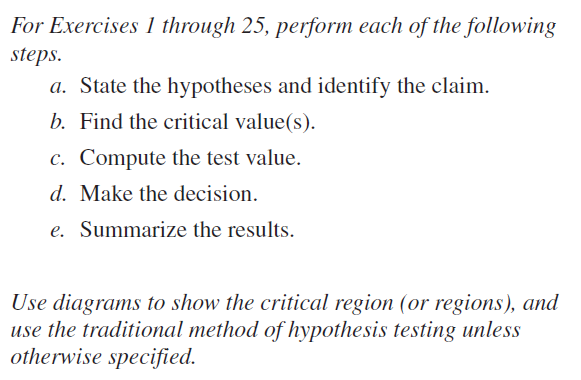
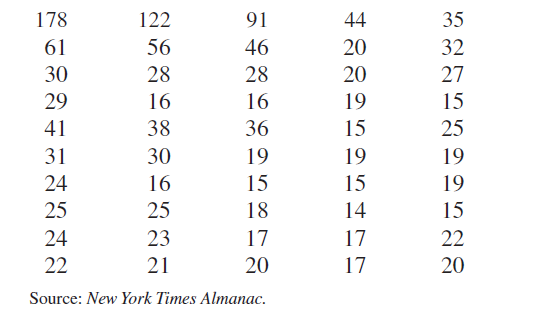
QUESTION 3 Perform appropriate analysis: Exercise 8-2; Question 12, page 436 from textbook by A.G Bluman, Elementary Statistics: A step by Step Approach, 9th ed., McGraw Hill Higher Education, 2014, ISBN: 9781259251665.12. Student Expenditures The average expenditure per student (based on average daily attendance) for a certain school year was $10,337 with a population standard deviation of $1560. A survey for the next school year of 150 randomly selected students resulted in a sample mean of $10,798. Do these results indicate that the average expenditure has changed? Choose your own level of signicance. Source: World Almanac. For Exercises 1 through 25, perform each of the foiiowing steps. a. State the hypotheses and identify the claim. b. Find the critical value(s). c. Compute the test value. d. Make the decision. e. Summarize the results. Use diagrams to show the critical region 1' or regions ,1, and use the traditionai method of hypothesis testing aniess otherwise specied. 178 122 91 44 35 61 56 46 20 32 30 28 28 20 27 29 16 16 15 41 38 36 25 31 30 19 19 24 16 15 19 25 25 18 15 24 23 17 22 22 21 20 17 20 Source: New York Times Almanac
Step by Step Solution
There are 3 Steps involved in it

Get step-by-step solutions from verified subject matter experts