

Question: please answer the question. QUESTION4 Perform appropriate analysis: Exercise 8-2; Question 17, page 436 from textbook by A.G Bluman, Elementary Statistics: A step by Step
please answer the question.
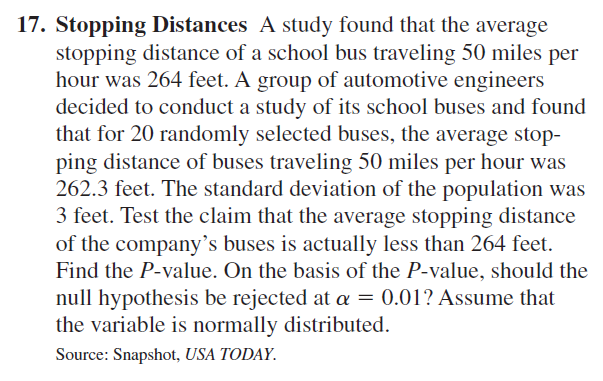
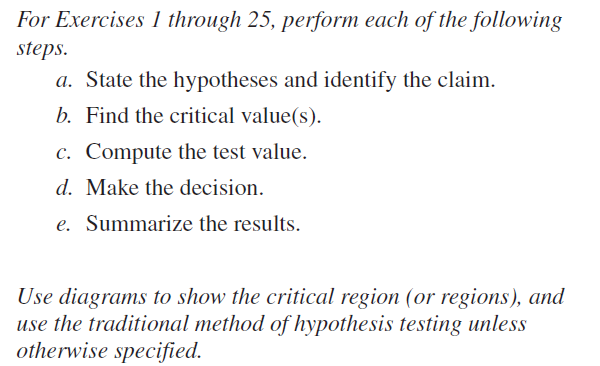
QUESTION4 Perform appropriate analysis: Exercise 8-2; Question 17, page 436 from textbook by A.G Bluman, Elementary Statistics: A step by Step Approach, 9th ed., McGraw Hill Higher Education, 2014, ISBN: 9781259251665.17. Stopping Distances A study found that the average stopping distance of a school bus traveling 50 miles per hour was 264 feet. A group of automotive engineers decided to conduct a study of its school buses and found that for 20 randomly selected buses, the average stop- ping distance of buses traveling 50 miles per hour was 262.3 feet. The standard deviation of the population was 3 feet. Test the claim that the average stopping distance of the company's buses is actually less than 264 feet. Find the P-value. On the basis of the Pvalue, should the null hypothesis be rejected at a: = 0.01? Assume that the variable is normally distributed. Source: Snapshot. USA TODAY. For Exercises 1 through 25, perform each of the following steps. a. State the hypotheses and identify the claim. l9. Find the critical value(s). c. Compute the test value. a. Make the decision. e. Summarize the results. Use diagrams to show the critical region 1\" or regions ,1, and use the traditional method of hypothesis testing unless otherwise specy'ied. 178 122 91 44 35 61 56 46 20 32 30 28 28 20 27 29 16 16 15 41 38 36 25 31 30 19 19 24 16 15 19 25 25 18 15 24 23 17 17 22 22 21 20 17 20 Source: New York Times Almanac
Step by Step Solution
There are 3 Steps involved in it

Get step-by-step solutions from verified subject matter experts