

Question: Please answer all the questions Below is data from the case. Use the Westfield Corporation Excel documents for questions 3 to 18. 4. How is
Please answer all the questions Below is data from the case.
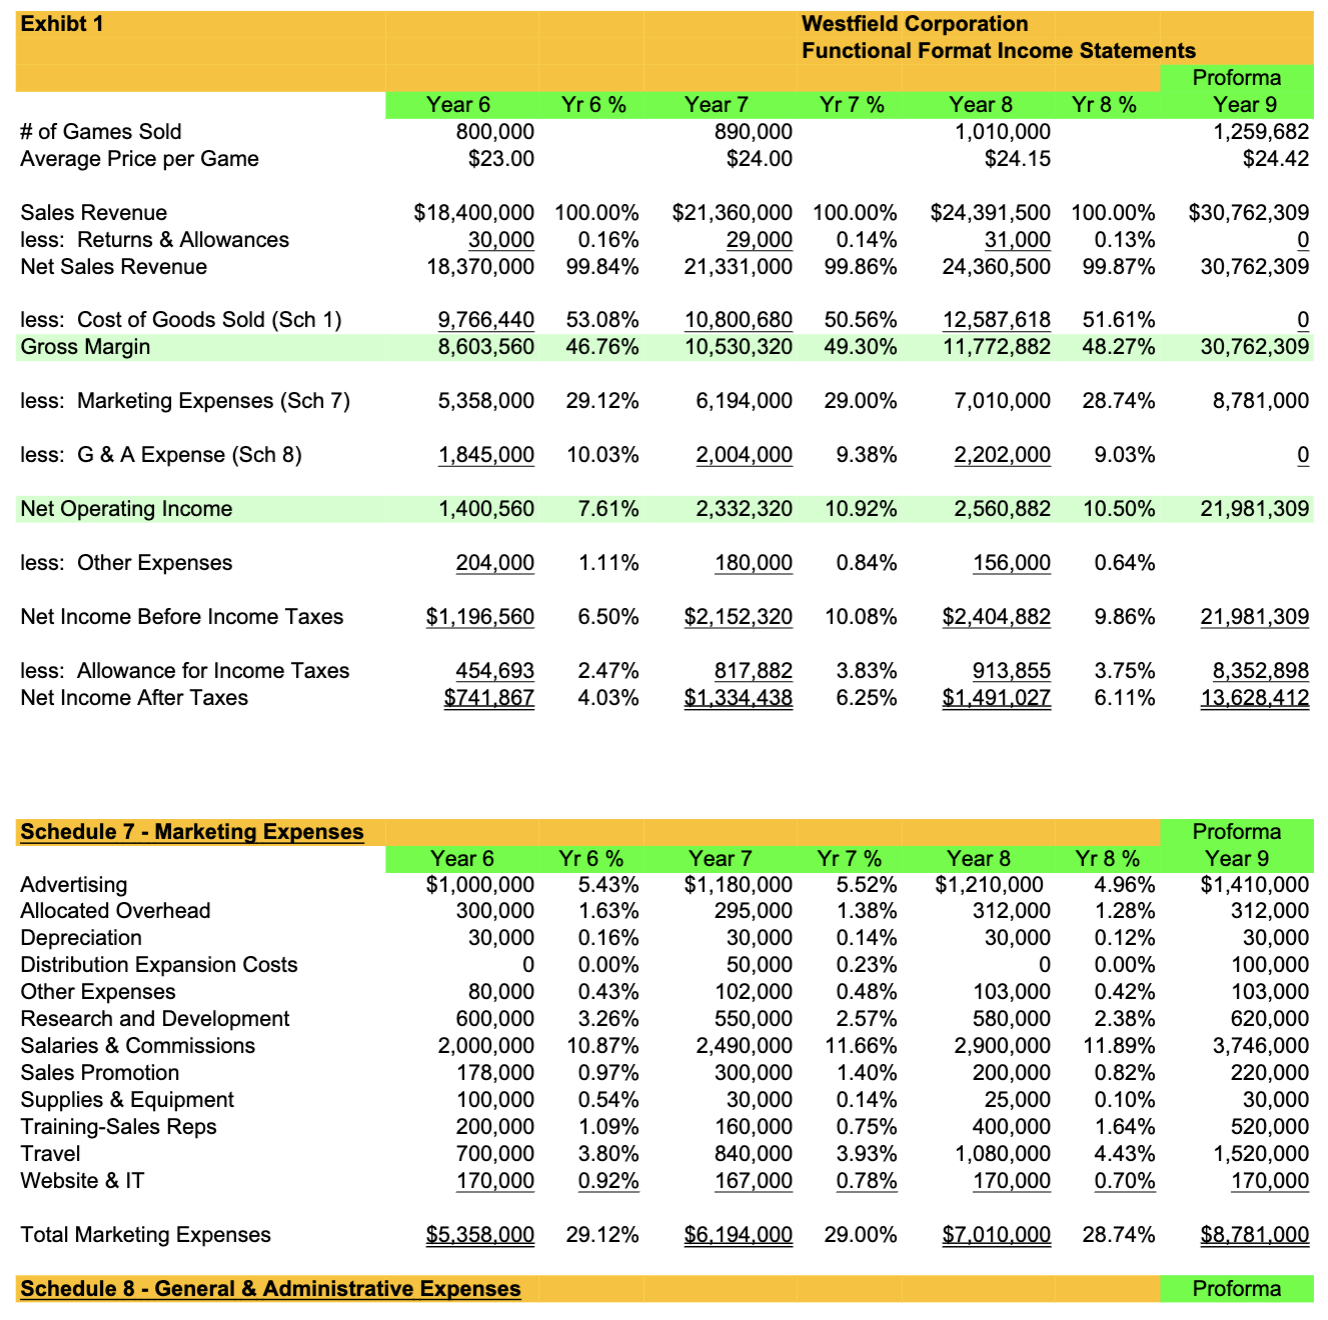
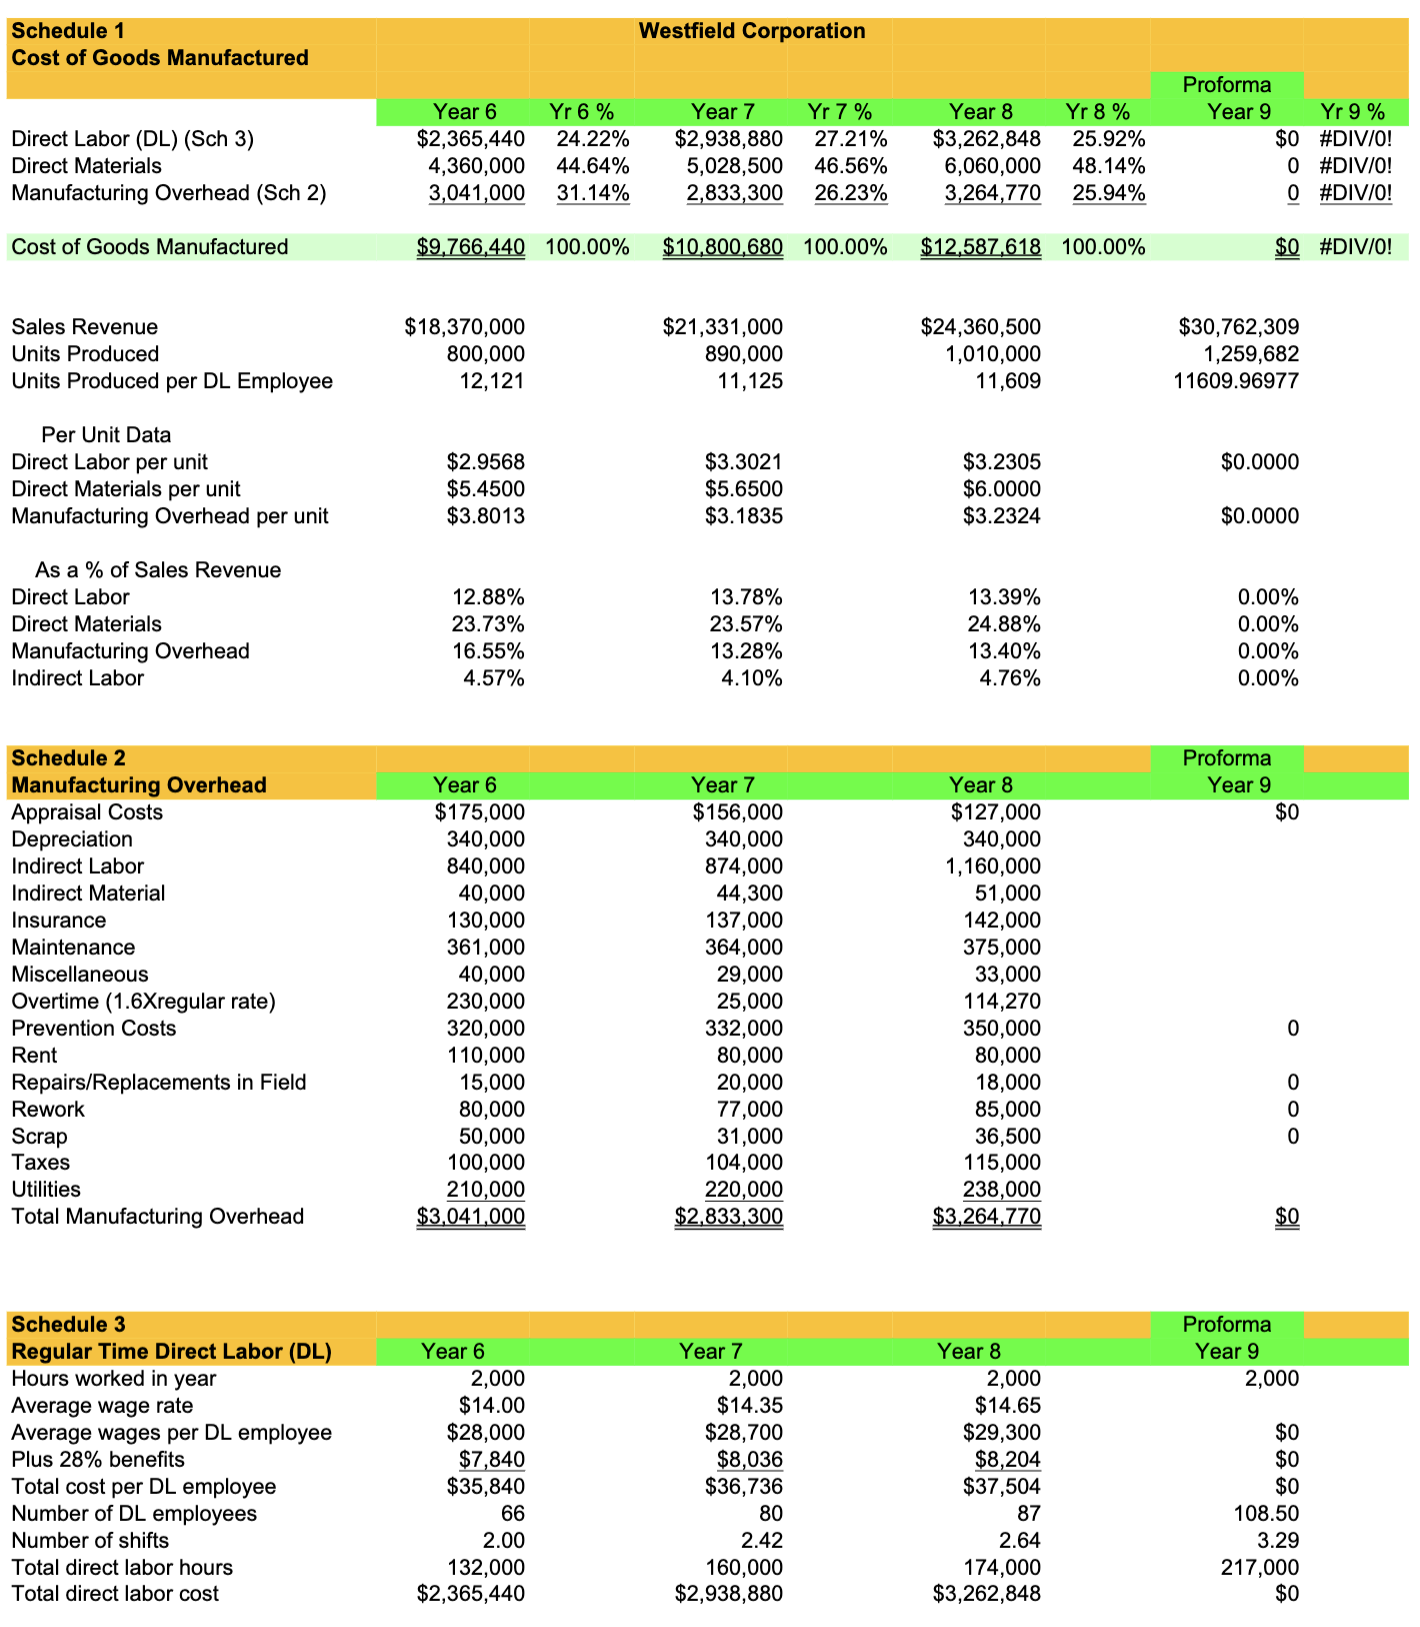
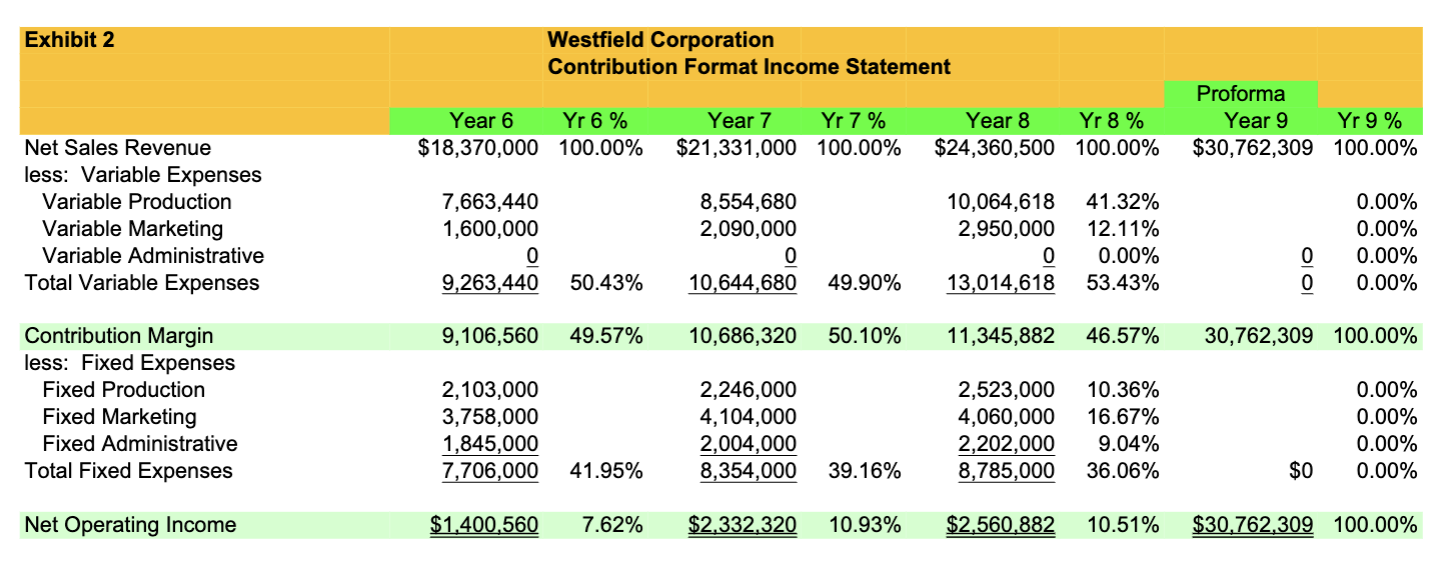
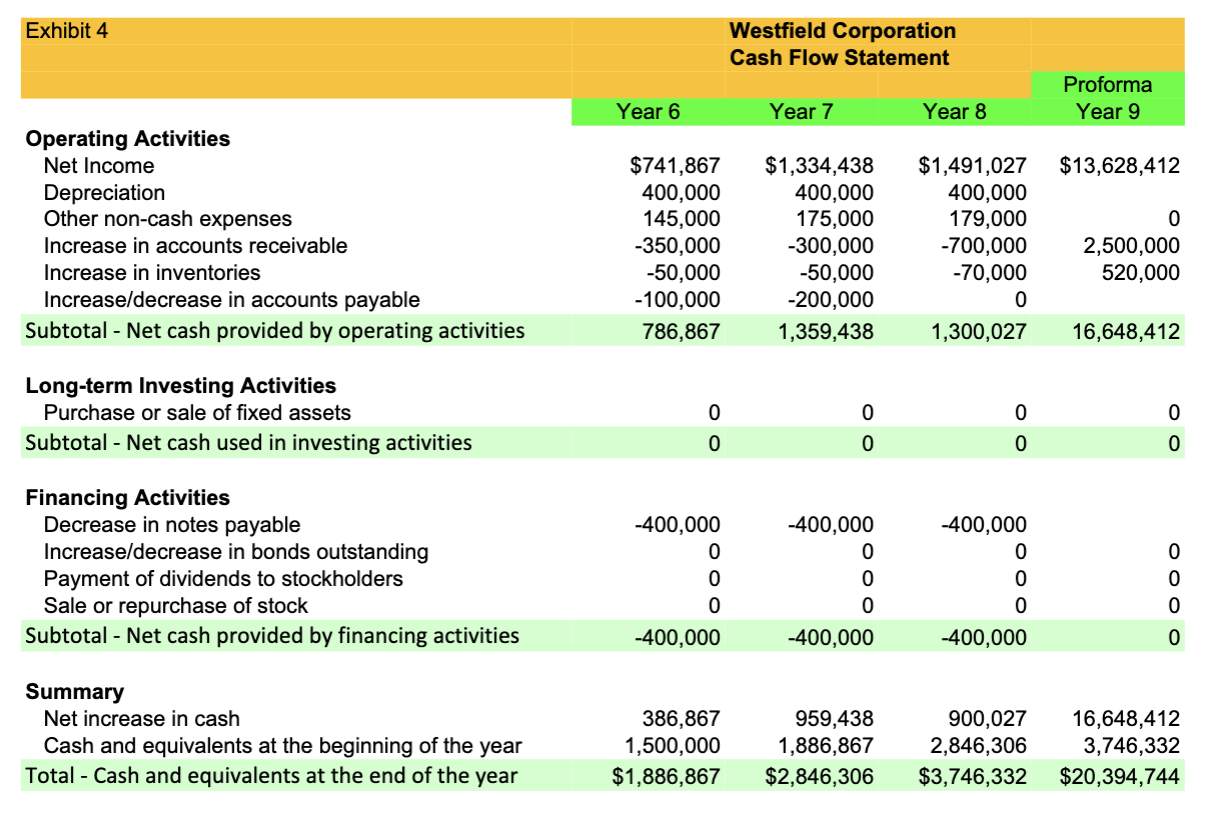
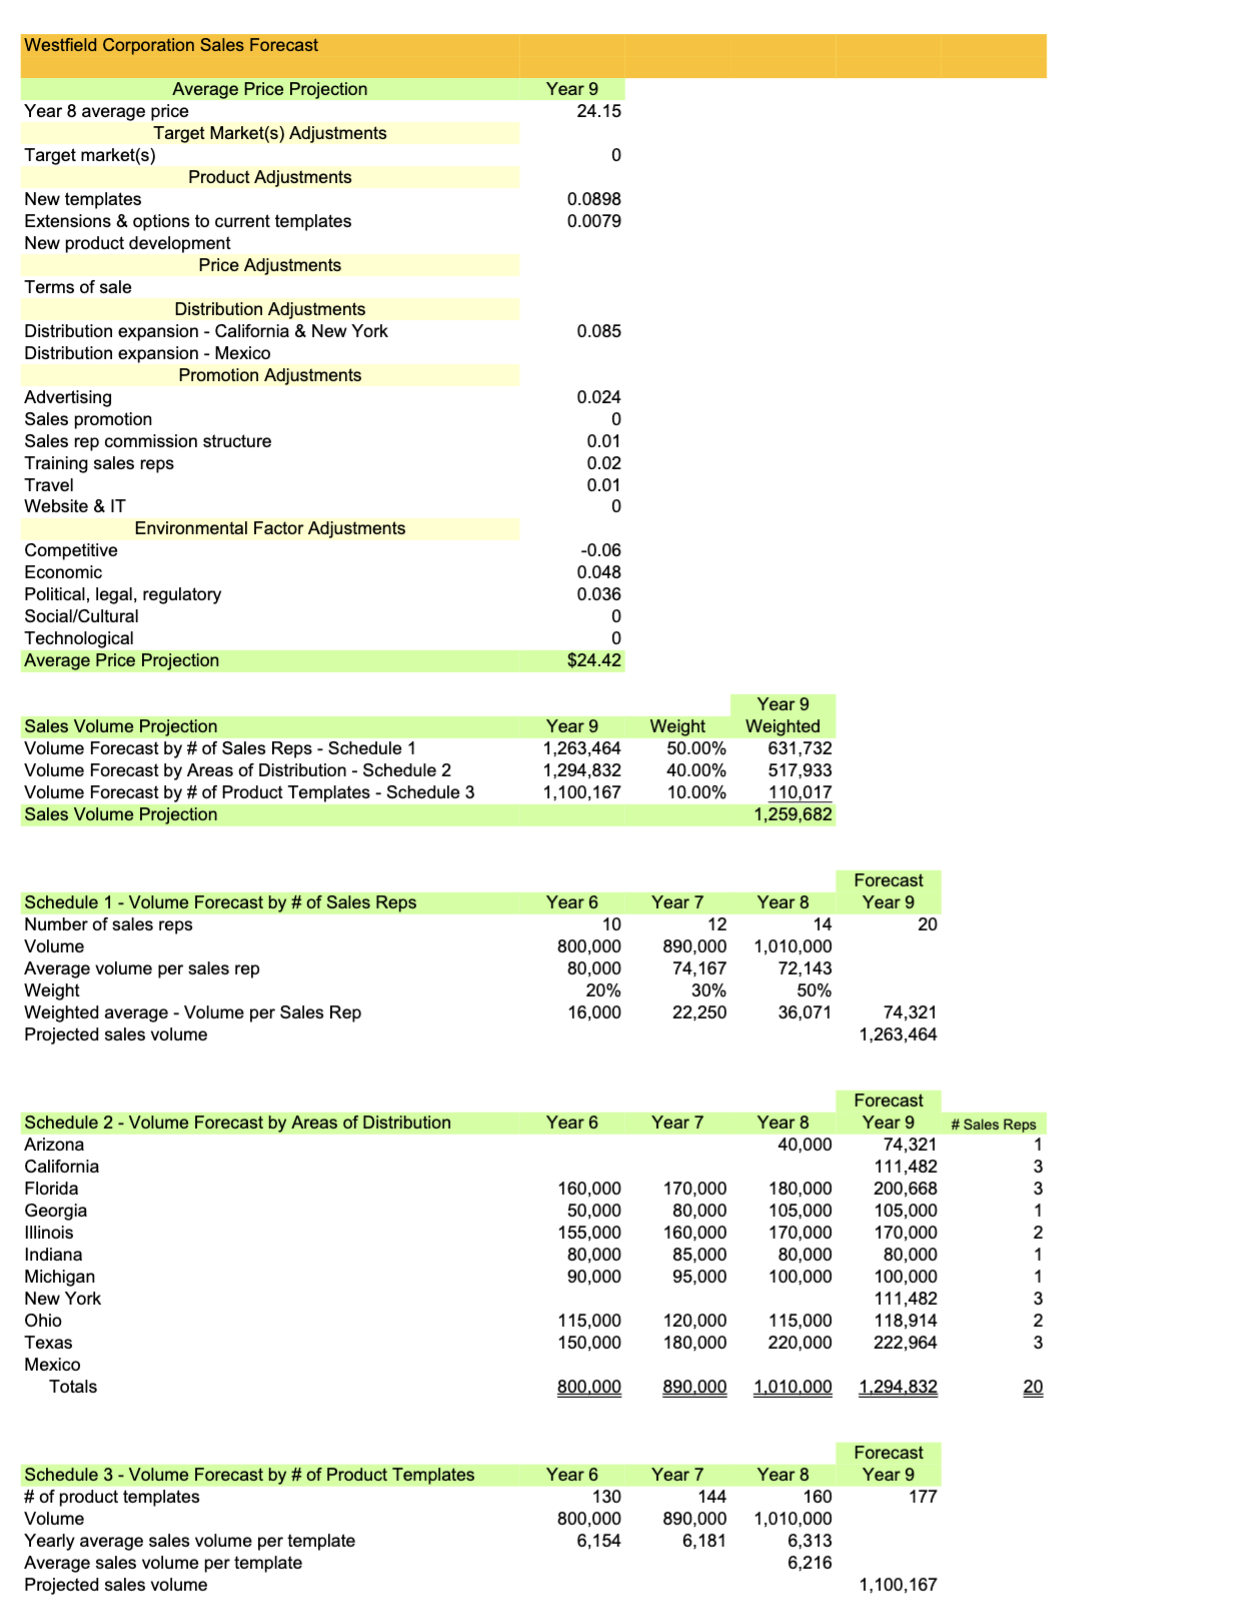
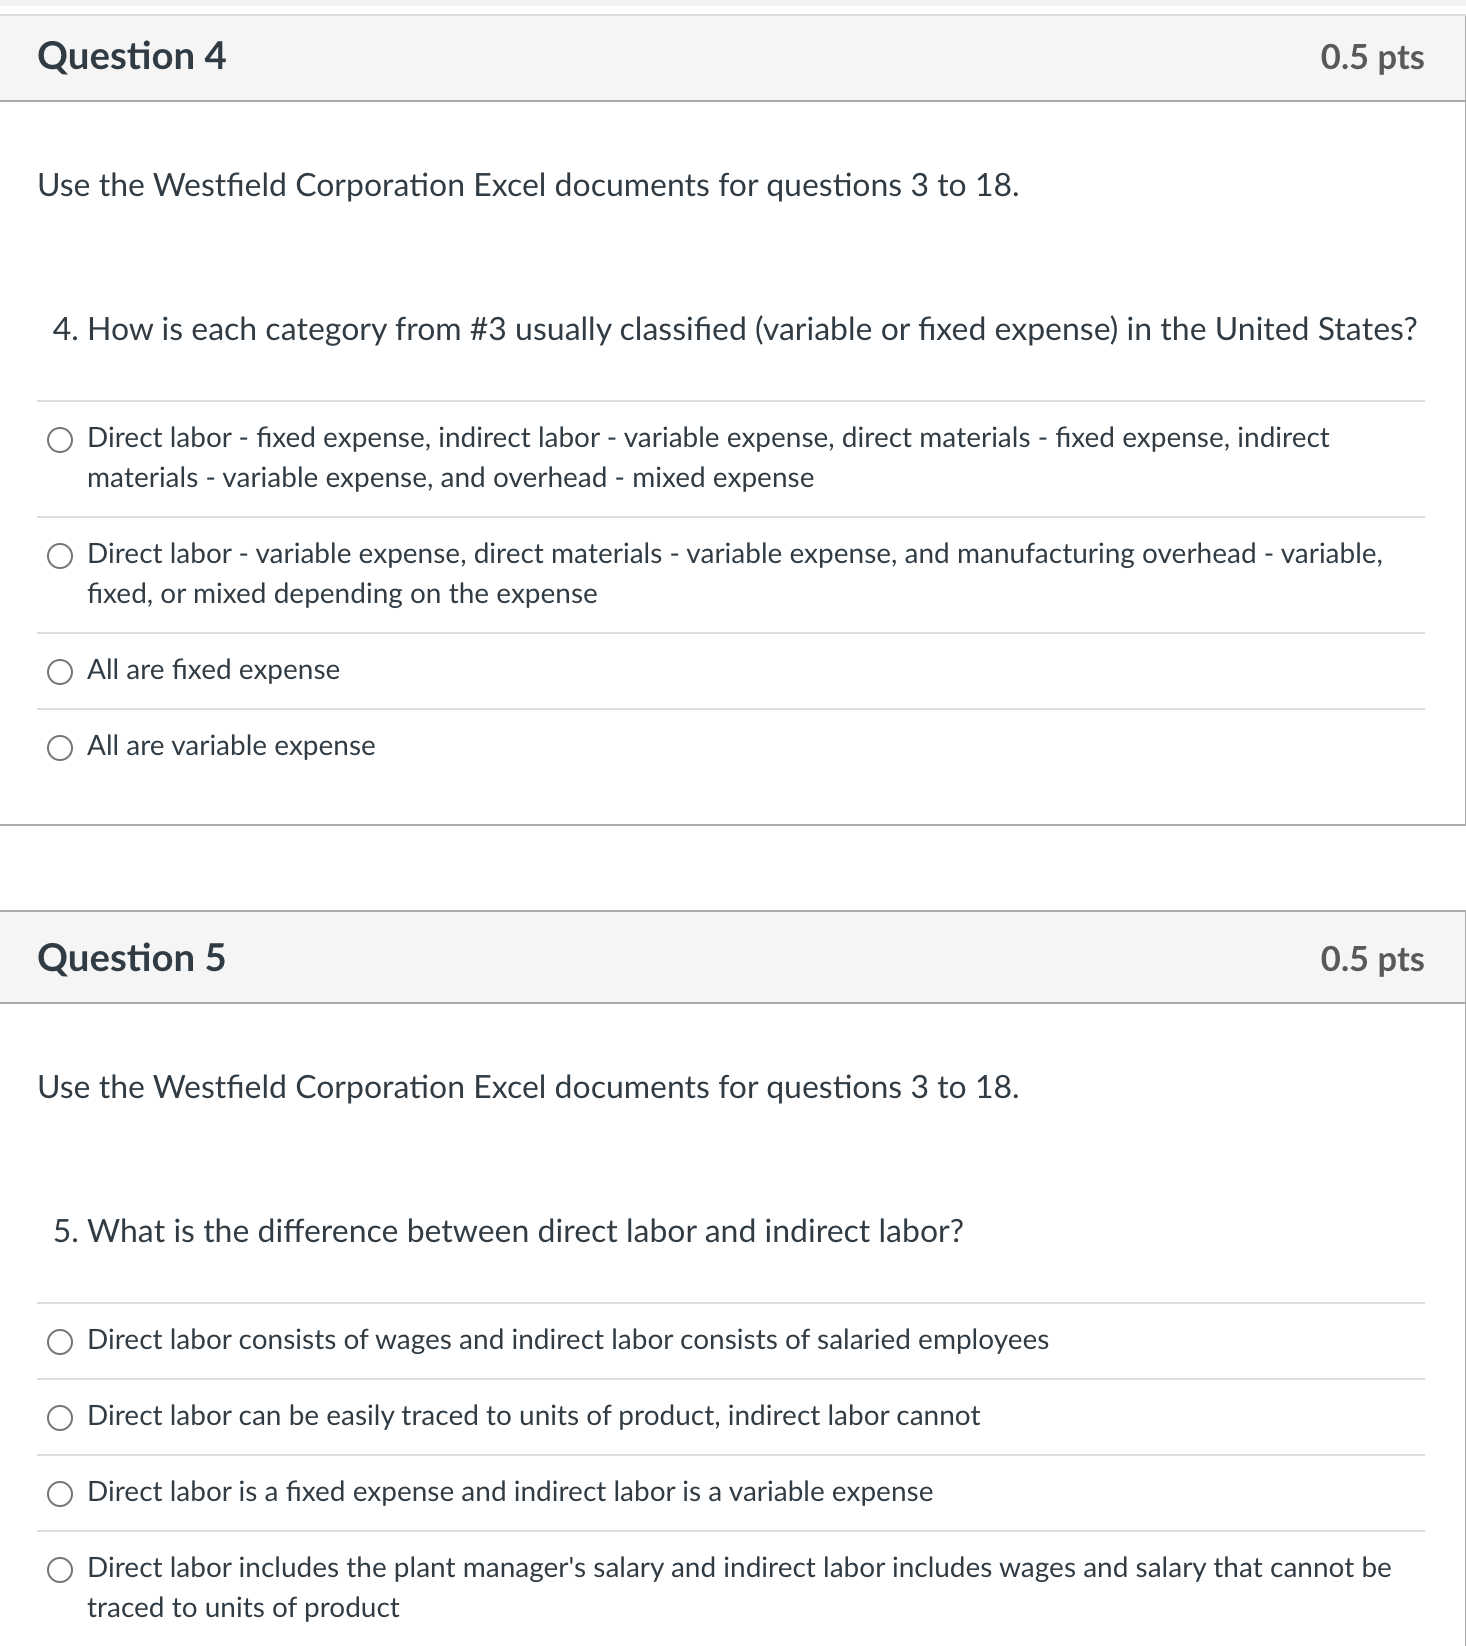
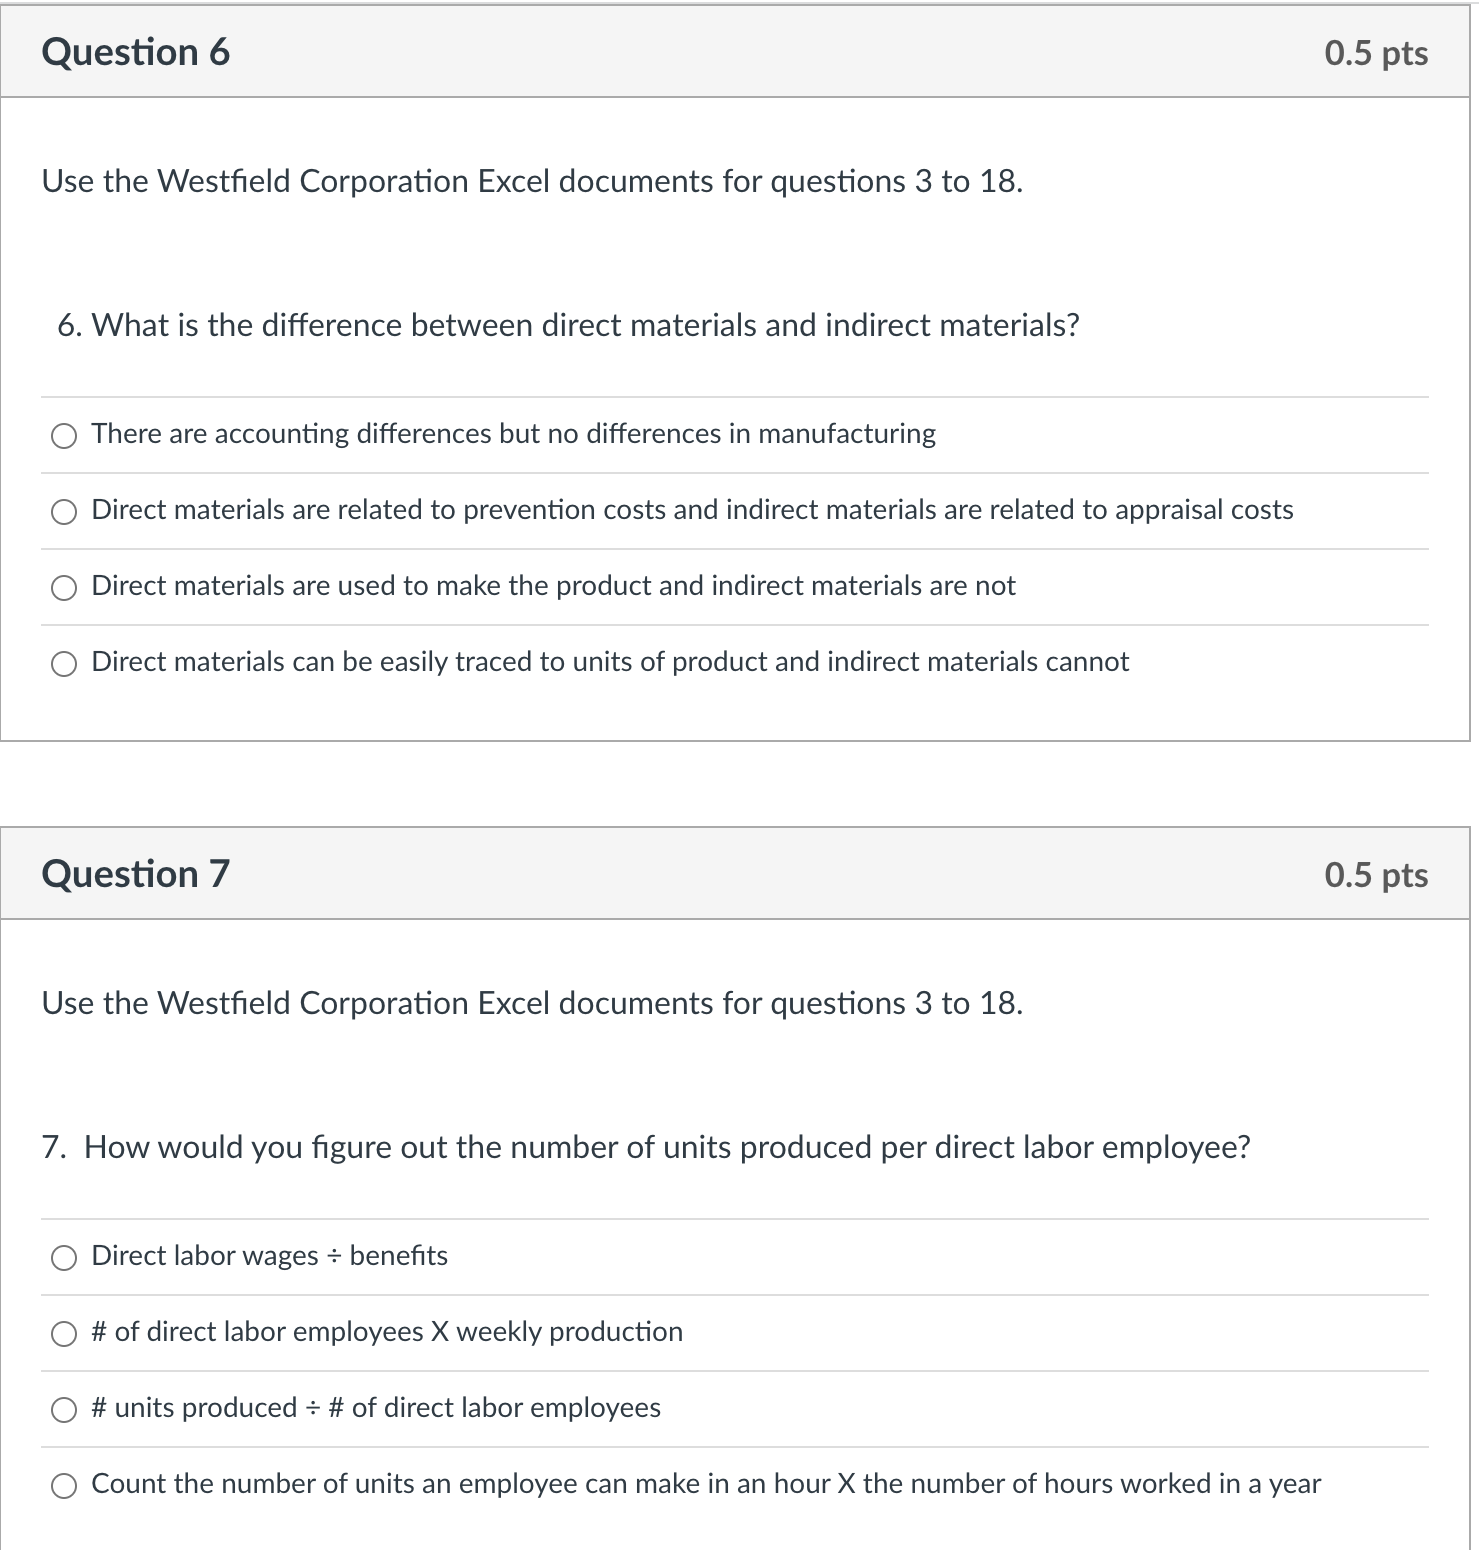
Use the Westfield Corporation Excel documents for questions 3 to 18. 4. How is each category from \#3 usually classified (variable or fixed expense) in the United States? Direct labor - fixed expense, indirect labor - variable expense, direct materials - fixed expense, indirect materials - variable expense, and overhead - mixed expense Direct labor - variable expense, direct materials - variable expense, and manufacturing overhead - variable, fixed, or mixed depending on the expense All are fixed expense All are variable expense Question 5 0.5pts Use the Westfield Corporation Excel documents for questions 3 to 18. 5. What is the difference between direct labor and indirect labor? Direct labor consists of wages and indirect labor consists of salaried employees Direct labor can be easily traced to units of product, indirect labor cannot Direct labor is a fixed expense and indirect labor is a variable expense Direct labor includes the plant manager's salary and indirect labor includes wages and salary that cannot be traced to units of product Westfield Corporation \begin{tabular}{|c|c|c|c|c|} \hline \multirow[t]{2}{*}{ Exhibit 4} & \multicolumn{3}{|c|}{\begin{tabular}{l} Westfield Corporation \\ Cash Flow Statement \end{tabular}} & \multirow[b]{2}{*}{\begin{tabular}{l} Proforma \\ Year 9 \end{tabular}} \\ \hline & Year 6 & Year 7 & Year 8 & \\ \hline \multicolumn{5}{|l|}{ Operating Activities } \\ \hline Net Income & $741,867 & $1,334,438 & $1,491,027 & $13,628,412 \\ \hline Depreciation & 400,000 & 400,000 & 400,000 & \\ \hline Other non-cash expenses & 145,000 & 175,000 & 179,000 & 0 \\ \hline Increase in accounts receivable & 350,000 & 300,000 & 700,000 & 2,500,000 \\ \hline Increase in inventories & 50,000 & 50,000 & 70,000 & 520,000 \\ \hline Increase/decrease in accounts payable & 100,000 & 200,000 & 0 & \\ \hline Subtotal - Net cash provided by operating activities & 786,867 & 1,359,438 & 1,300,027 & 16,648,412 \\ \hline \multicolumn{5}{|l|}{ Long-term Investing Activities } \\ \hline Purchase or sale of fixed assets & 0 & 0 & 0 & 0 \\ \hline Subtotal - Net cash used in investing activities & 0 & 0 & 0 & 0 \\ \hline \multicolumn{5}{|l|}{ Financing Activities } \\ \hline Decrease in notes payable & 400,000 & 400,000 & 400,000 & \\ \hline Increase/decrease in bonds outstanding & 0 & 0 & 0 & 0 \\ \hline Payment of dividends to stockholders & 0 & 0 & 0 & 0 \\ \hline Sale or repurchase of stock & 0 & 0 & 0 & 0 \\ \hline Subtotal - Net cash provided by financing activities & 400,000 & 400,000 & 400,000 & 0 \\ \hline \multicolumn{5}{|l|}{ Summary } \\ \hline Net increase in cash & 386,867 & 959,438 & 900,027 & 16,648,412 \\ \hline Cash and equivalents at the beginning of the year & 1,500,000 & 1,886,867 & 2,846,306 & 3,746,332 \\ \hline Total - Cash and equivalents at the end of the year & $1,886,867 & $2,846,306 & $3,746,332 & $20,394,744 \\ \hline \end{tabular} William Carlton Haeberle (2018) \begin{tabular}{|c|c|c|c|c|c|c|c|c|} \hline \multirow{2}{*}{\begin{tabular}{l} Schedule 1 \\ Cost of Goods Manufactured \end{tabular}} & \multirow[b]{2}{*}{ Year 6} & \multirow[b]{2}{*}{ Yr 6%} & \multicolumn{2}{|c|}{ Westfield Corporation } & \multirow[b]{2}{*}{ Year 8} & \multirow[b]{2}{*}{ Yr 8%} & \multirow[b]{2}{*}{\begin{tabular}{r} Proforma \\ Year 9 \end{tabular}} & \multirow[b]{2}{*}{ Yr 9%} \\ \hline & & & Year 7 & Yr 7% & & & & \\ \hline Direct Labor (DL) (Sch 3) & $2,365,440 & 24.22% & $2,938,880 & 27.21% & $3,262,848 & 25.92% & $0 & \#DIV/0! \\ \hline Direct Materials & 4,360,000 & 44.64% & 5,028,500 & 46.56% & 6,060,000 & 48.14% & 0 & \#DIV/0! \\ \hline Manufacturing Overhead (Sch 2) & 3,041,000 & 31.14% & 2,833,300 & 26.23% & 3,264,770 & 25.94% & 0 & \#DIV/0! \\ \hline Cost of Goods Manufactured & $9,766,440 & 100.00% & $10,800,680 & 100.00% & $12,587,618 & 100.00% & $0 & \#DIV/0! \\ \hline Sales Revenue & $18,370,000 & & $21,331,000 & & $24,360,500 & & $30,762,309 & \\ \hline Units Produced & 800,000 & & 890,000 & & 1,010,000 & & 1,259,682 & \\ \hline Units Produced per DL Employee & 12,121 & & 11,125 & & 11,609 & & 11609.96977 & \\ \hline \multicolumn{9}{|l|}{ Per Unit Data } \\ \hline Direct Labor per unit & $2.9568 & & $3.3021 & & $3.2305 & & $0.0000 & \\ \hline Direct Materials per unit & $5.4500 & & $5.6500 & & $6.0000 & & & \\ \hline Manufacturing Overhead per unit & $3.8013 & & $3.1835 & & $3.2324 & & $0.0000 & \\ \hline \multicolumn{9}{|l|}{ As a % of Sales Revenue } \\ \hline Direct Labor & 12.88% & & 13.78% & & 13.39% & & 0.00% & \\ \hline Direct Materials & 23.73% & & 23.57% & & 24.88% & & 0.00% & \\ \hline Manufacturing Overhead & 16.55% & & 13.28% & & 13.40% & & 0.00% & \\ \hline Indirect Labor & 4.57% & & 4.10% & & 4.76% & & 0.00% & \\ \hline \end{tabular} \begin{tabular}{|c|c|c|c|c|} \hline \begin{tabular}{l} Schedule 2 \\ Manufacturing Overhead \end{tabular} & Year 6 & Year 7 & Year 8 & \begin{tabular}{l} Proforma \\ Year 9 \end{tabular} \\ \hline Appraisal Costs & $175,000 & $156,000 & $127,000 & $0 \\ \hline Depreciation & 340,000 & 340,000 & 340,000 & \\ \hline Indirect Labor & 840,000 & 874,000 & 1,160,000 & \\ \hline Indirect Material & 40,000 & 44,300 & 51,000 & \\ \hline Insurance & 130,000 & 137,000 & 142,000 & \\ \hline Maintenance & 361,000 & 364,000 & 375,000 & \\ \hline Miscellaneous & 40,000 & 29,000 & 33,000 & \\ \hline Overtime (1.6Xregular rate) & 230,000 & 25,000 & 114,270 & \\ \hline Prevention Costs & 320,000 & 332,000 & 350,000 & 0 \\ \hline Rent & 110,000 & 80,000 & 80,000 & \\ \hline Repairs/Replacements in Field & 15,000 & 20,000 & 18,000 & 0 \\ \hline Rework & 80,000 & 77,000 & 85,000 & 0 \\ \hline Scrap & 50,000 & 31,000 & 36,500 & 0 \\ \hline Taxes & 100,000 & 104,000 & 115,000 & \\ \hline Utilities & 210,000 & 220,000 & 238,000 & \\ \hline Total Manufacturing Overhead & $3,041,000 & $2,833,300 & $3,264,770 & $0 \\ \hline \end{tabular} \begin{tabular}{lrrrr} Schedule 3 & \multicolumn{3}{c}{ Proforma } \\ Regular Time Direct Labor (DL) & \multicolumn{1}{c}{ Year 6 } & Year 7 & \multicolumn{1}{c}{ Year 9 } \\ Hours worked in year & 2,000 & 2,000 & 2,000 & 2,000 \\ Average wage rate & $14.00 & $14.35 & $14.65 & \\ Average wages per DL employee & $28,000 & $28,700 & $29,300 & \\ Plus 28\% benefits & $7,840 & $8,036 & $8,204 & $0 \\ Total cost per DL employee & $35,840 & $36,736 & $37,504 & 87 \\ Number of DL employees & 66 & 80 & 2.64 & 108.50 \\ Number of shifts & 2.00 & 2.42 & 174,000 & 3.29 \\ Total direct labor hours & 132,000 & 160,000 & $3,262,848 & $000 \\ Total direct labor cost & $2,365,440 & $2,938,880 & \end{tabular} \begin{tabular}{|c|c|c|c|c|c|c|c|} \hline \multirow[t]{3}{*}{ Exhibt 1} & \multirow[b]{3}{*}{ Year 6} & \multirow[b]{3}{*}{ Yr 6%} & \multicolumn{5}{|c|}{\begin{tabular}{l} Westfield Corporation \\ Functional Format Income Statements \end{tabular}} \\ \hline & & & & & & & Proforma \\ \hline & & & Year 7 & Yr 7% & Year 8 & Yr8% & Year 9 \\ \hline \# of Games Sold & 800,000 & & 890,000 & & 1,010,000 & & 1,259,682 \\ \hline Average Price per Game & $23.00 & & $24.00 & & $24.15 & & $24.42 \\ \hline Sales Revenue & $18,400,000 & 100.00% & $21,360,000 & 100.00% & $24,391,500 & 100.00% & $30,762,309 \\ \hline less: Returns \& Allowances & 30,000 & 0.16% & 29,000 & 0.14% & 31,000 & 0.13% & 0 \\ \hline Net Sales Revenue & 18,370,000 & 99.84% & 21,331,000 & 99.86% & 24,360,500 & 99.87% & 30,762,309 \\ \hline less: Cost of Goods Sold (Sch 1) & 9,766,440 & 53.08% & 10,800,680 & 50.56% & 12,587,618 & 51.61% & 0 \\ \hline Gross Margin & 8,603,560 & 46.76% & 10,530,320 & 49.30% & 11,772,882 & 48.27% & 30,762,309 \\ \hline less: Marketing Expenses (Sch 7) & 5,358,000 & 29.12% & 6,194,000 & 29.00% & 7,010,000 & 28.74% & 8,781,000 \\ \hline less: G \& A Expense (Sch 8) & 1,845,000 & 10.03% & 2,004,000 & 9.38% & 2,202,000 & 9.03% & \\ \hline Net Operating Income & 1,400,560 & 7.61% & 2,332,320 & 10.92% & 2,560,882 & 10.50% & 21,981,309 \\ \hline less: Other Expenses & 204,000 & 1.11% & 180,000 & 0.84% & 156,000 & 0.64% & \\ \hline Net Income Before Income Taxes & $1,196,560 & 6.50% & $2,152,320 & 10.08% & $2,404,882 & 9.86% & 21,981,309 \\ \hline less: Allowance for Income Taxes & 454,693 & 2.47% & 817,882 & 3.83% & 913,855 & 3.75% & 8,352,898 \\ \hline Net Income After Taxes & $741,867 & 4.03% & $1,334,438 & 6.25% & $1,491,027 & 6.11% & 13,628,412 \\ \hline \end{tabular} \begin{tabular}{|c|c|c|c|c|c|c|c|} \hline Schedule 7 - Marketing Expenses & & & & & & & Proforma \\ \hline & Year 6 & Yr 6% & Year 7 & Yr 7% & Year 8 & Yr 8% & Year 9 \\ \hline Advertising & $1,000,000 & 5.43% & $1,180,000 & 5.52% & $1,210,000 & 4.96% & $1,410,000 \\ \hline Allocated Overhead & 300,000 & 1.63% & 295,000 & 1.38% & 312,000 & 1.28% & 312,000 \\ \hline Depreciation & 30,000 & 0.16% & 30,000 & 0.14% & 30,000 & 0.12% & 30,000 \\ \hline Distribution Expansion Costs & 0 & 0.00% & 50,000 & 0.23% & 0 & 0.00% & 100,000 \\ \hline Other Expenses & 80,000 & 0.43% & 102,000 & 0.48% & 103,000 & 0.42% & 103,000 \\ \hline Research and Development & 600,000 & 3.26% & 550,000 & 2.57% & 580,000 & 2.38% & 620,000 \\ \hline Salaries \& Commissions & 2,000,000 & 10.87% & 2,490,000 & 11.66% & 2,900,000 & 11.89% & 3,746,000 \\ \hline Sales Promotion & 178,000 & 0.97% & 300,000 & 1.40% & 200,000 & 0.82% & 220,000 \\ \hline Supplies \& Equipment & 100,000 & 0.54% & 30,000 & 0.14% & 25,000 & 0.10% & 30,000 \\ \hline Training-Sales Reps & 200,000 & 1.09% & 160,000 & 0.75% & 400,000 & 1.64% & 520,000 \\ \hline Travel & 700,000 & 3.80% & 840,000 & 3.93% & 1,080,000 & 4.43% & 1,520,000 \\ \hline Website \& IT & 170,000 & 0.92% & 167,000 & 0.78% & 170,000 & 0.70% & 170,000 \\ \hline Total Marketing Expenses & $5,358,000 & 29.12% & $6,194,000 & 29.00% & $7,010,000 & 28.74% & $8,781,000 \\ \hline \end{tabular} Schedule 8 - General \& Administrative Expenses Proforma Use the Westfield Corporation Excel documents for questions 3 to 18. 6. What is the difference between direct materials and indirect materials? There are accounting differences but no differences in manufacturing Direct materials are related to prevention costs and indirect materials are related to appraisal costs Direct materials are used to make the product and indirect materials are not Direct materials can be easily traced to units of product and indirect materials cannot Question 7 0.5 pts Use the Westfield Corporation Excel documents for questions 3 to 18. 7. How would you figure out the number of units produced per direct labor employee? Direct labor wages benefits \# of direct labor employees X weekly production \# units produced \# of direct labor employees Count the number of units an employee can make in an hour X the number of hours worked in a year \begin{tabular}{|c|c|c|c|c|c|c|c|c|} \hline \multirow[t]{2}{*}{ Exhibit 2} & \multicolumn{5}{|c|}{\begin{tabular}{l} Westfield Corporation \\ Contribution Format Income Statement \end{tabular}} & \multirow[b]{2}{*}{ Yr 8%} & \multirow{2}{*}{ Proforma } & \multirow[b]{2}{*}{Yr9%} \\ \hline & Year 6 & Yr6% & Year 7 & Yr7% & Year 8 & & & \\ \hline \begin{tabular}{l} Net Sales Revenue \\ less: Variable Expenses \end{tabular} & $18,370,000 & 100.00% & $21,331,000 & 100.00% & $24,360,500 & 100.00% & $30,762,309 & 100.00% \\ \hline Variable Production & 7,663,440 & & 8,554,680 & & 10,064,618 & 41.32% & & 0.00% \\ \hline Variable Marketing & 1,600,000 & & 2,090,000 & & 2,950,000 & 12.11% & & 0.00% \\ \hline Variable Administrative & 0 & & 0 & & 0 & 0.00% & 0 & 0.00% \\ \hline Total Variable Expenses & 9,263,440 & 50.43% & 10,644,680 & 49.90% & 13,014,618 & 53.43% & 0 & 0.00% \\ \hline Contribution Margin & 9,106,560 & 49.57% & 10,686,320 & 50.10% & 11,345,882 & 46.57% & 30,762,309 & 100.00% \\ \hline less: Fixed Expenses & & & & & & & & \\ \hline Fixed Production & 2,103,000 & & 2,246,000 & & 2,523,000 & 10.36% & & 0.00% \\ \hline Fixed Marketing & 3,758,000 & & 4,104,000 & & 4,060,000 & 16.67% & & 0.00% \\ \hline Fixed Administrative & 1,845,000 & & 2,004,000 & & 2,202,000 & 9.04% & & 0.00% \\ \hline Total Fixed Expenses & 7,706,000 & 41.95% & 8,354,000 & 39.16% & 8,785,000 & 36.06% & $0 & 0.00% \\ \hline Net Operating Income & $1,400,560 & 7.62% & $2,332,320 & 10.93% & $2,560,882 & 10.51% & $30,762,309 & 100.00% \\ \hline \end{tabular} Westfield Corporation Sales Forecast Average Price Projection Year 8 average price Target Market(s) Adjustments Target market(s) Product Adjustments New templates Extensions \& options to current templates New product development Price Adjustments Terms of sale Distribution Adjustments Distribution expansion - California \& New York Distribution expansion - Mexico Promotion Adjustments Advertising Sales promotion Sales rep commission structure Training sales reps Travel Website \& IT Environmental Factor Adjustments Competitive Economic Political, legal, regulatory Social/Cultural Technological Average Price Projection Year 9 24.15 0 0.0898 0.0079 0.085 0.024 0 0.01 0.02 0.01 0 0.06 0.048 0.036 0 $24.42 \begin{tabular}{lrrr} & & & \multicolumn{1}{c}{ Year 9 } \\ Sales Volume Projection & Year 9 & Weight & \multicolumn{1}{c}{ Weighted } \\ Volume Forecast by \# of Sales Reps - Schedule 1 & 1,263,464 & 50.00% & 631,732 \\ Volume Forecast by Areas of Distribution - Schedule 2 & 1,294,832 & 40.00% & 517,933 \\ Volume Forecast by \# of Product Templates - Schedule 3 & 1,100,167 & 10.00% & 110,017 \\ Sales Volume Projection & & & 1,259,682 \end{tabular} Schedule 1 - Volume Forecast by \# of Sales Reps Number of sales reps Volume Average volume per sales rep Weight Weighted average - Volume per Sales Rep Projected sales volume \begin{tabular}{|c|c|c|c|} \hline Year 6 & Year 7 & Year 8 & \begin{tabular}{c} Forecast \\ Year 9 \end{tabular} \\ \hline 10 & 12 & 14 & 20 \\ \hline 800,000 & 890,000 & 1,010,000 & \\ \hline 80,000 & 74,167 & 72,143 & \\ \hline 20% & 30% & 50% & \\ \hline 16,000 & 22,250 & 36,071 & \begin{tabular}{r} 74,321 \\ 1,263,464 \end{tabular} \\ \hline \end{tabular} Schedule 2 - Volume Forecast by Areas of Distribution Arizona California Florida Georgia Illinois Indiana Michigan New York Ohio Texas Mexico Totals \begin{tabular}{|c|c|c|c|c|} \hline Year 6 & Year 7 & Year 8 & \begin{tabular}{c} Forecast \\ Year 9 \end{tabular} & \# Sales Reps \\ \hline & & 40,000 & 74,321 & 1 \\ \hline & & & 111,482 & 3 \\ \hline 160,000 & 170,000 & 180,000 & 200,668 & 3 \\ \hline 50,000 & 80,000 & 105,000 & 105,000 & 1 \\ \hline 155,000 & 160,000 & 170,000 & 170,000 & 2 \\ \hline 80,000 & 85,000 & 80,000 & 80,000 & 1 \\ \hline \multirow[t]{2}{*}{90,000} & 95,000 & 100,000 & 100,000 & 1 \\ \hline & & & 111,482 & 3 \\ \hline 115,000 & 120,000 & 115,000 & 118,914 & 2 \\ \hline 150,000 & 180,000 & 220,000 & 222,964 & 3 \\ \hline 800,000 & 890,000 & 1.010,000 & 1.294,832 & 20 \\ \hline \end{tabular} Schedule 3 - Volume Forecast by \# of Product Templates \# of product templates Volume Yearly average sales volume per template Average sales volume per template Projected sales volume \begin{tabular}{rrrr} \multicolumn{1}{r|r}{ Year 6 } & \multicolumn{1}{c}{ Forecast } \\ 130 & 144 & 160 & 177 \\ 800,000 & 890,000 & 1,010,000 & \\ 6,154 & 6,181 & 6,313 & \\ & & 6,216 & \\ & & & 1,100,167 \end{tabular}
Step by Step Solution
There are 3 Steps involved in it

Get step-by-step solutions from verified subject matter experts