

Question: Please answer all the questions Below is data from the case. Use the Westfield Corporation Excel documents for questions 3 to 18. 16. Does the
Please answer all the questions Below is data from the case.
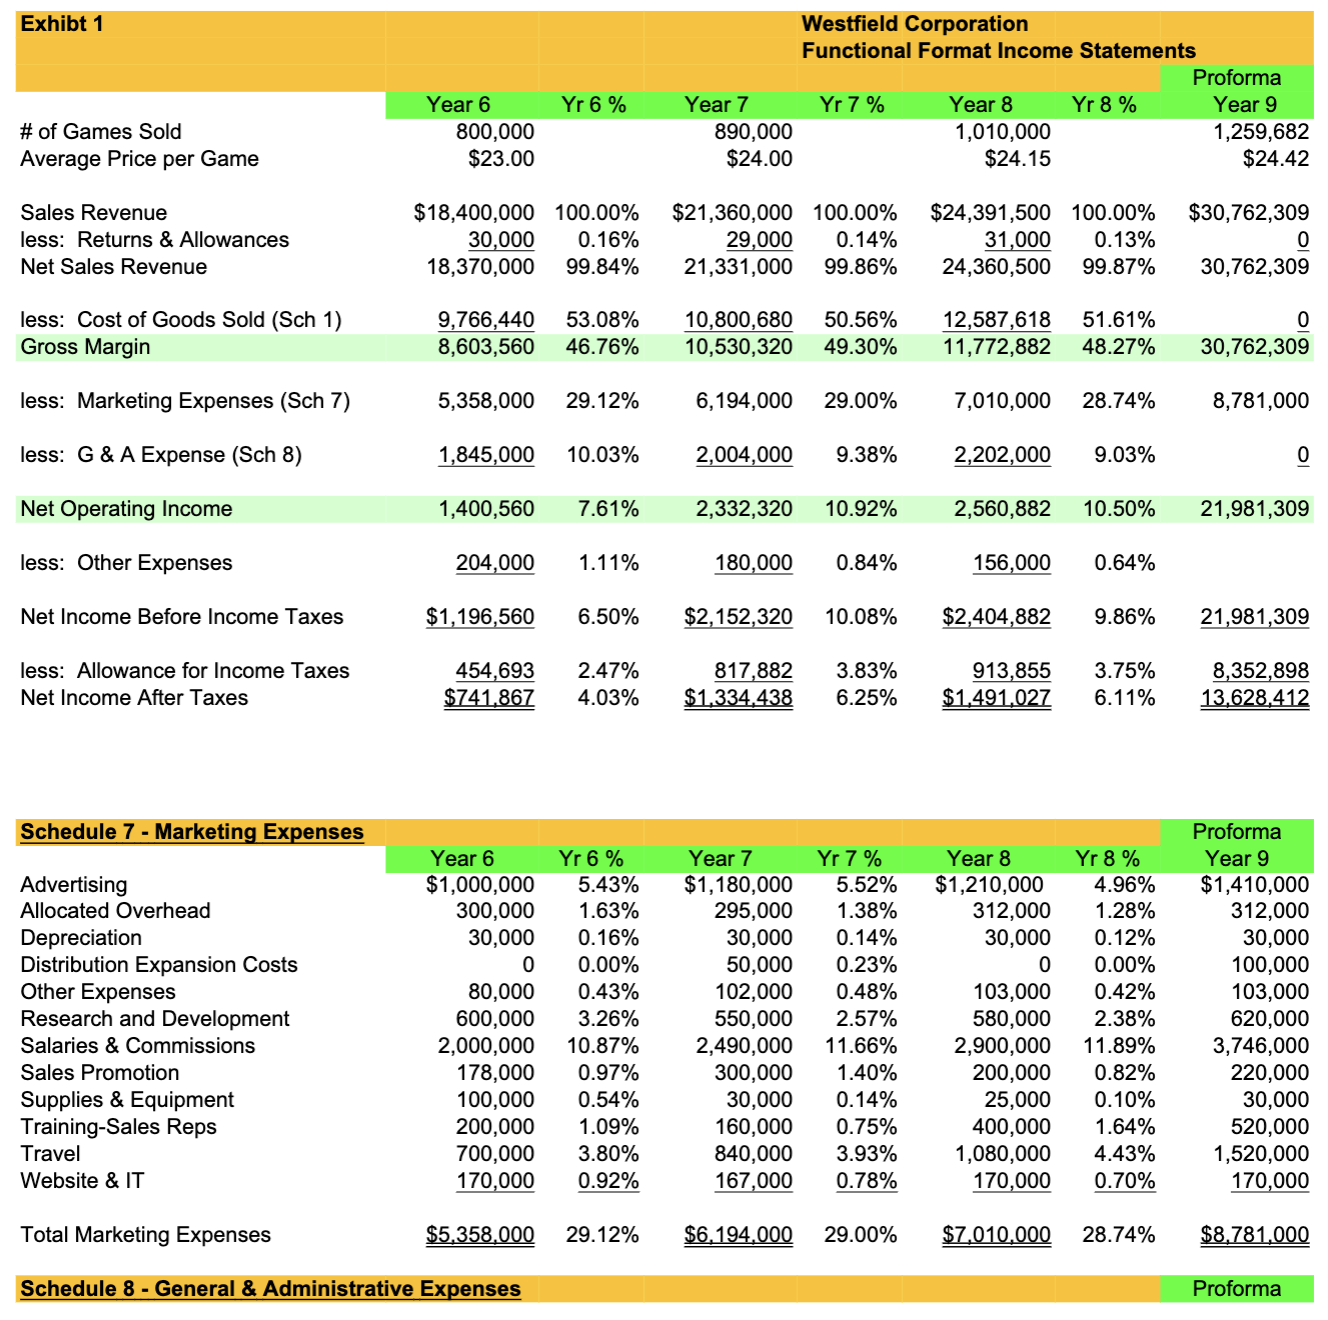
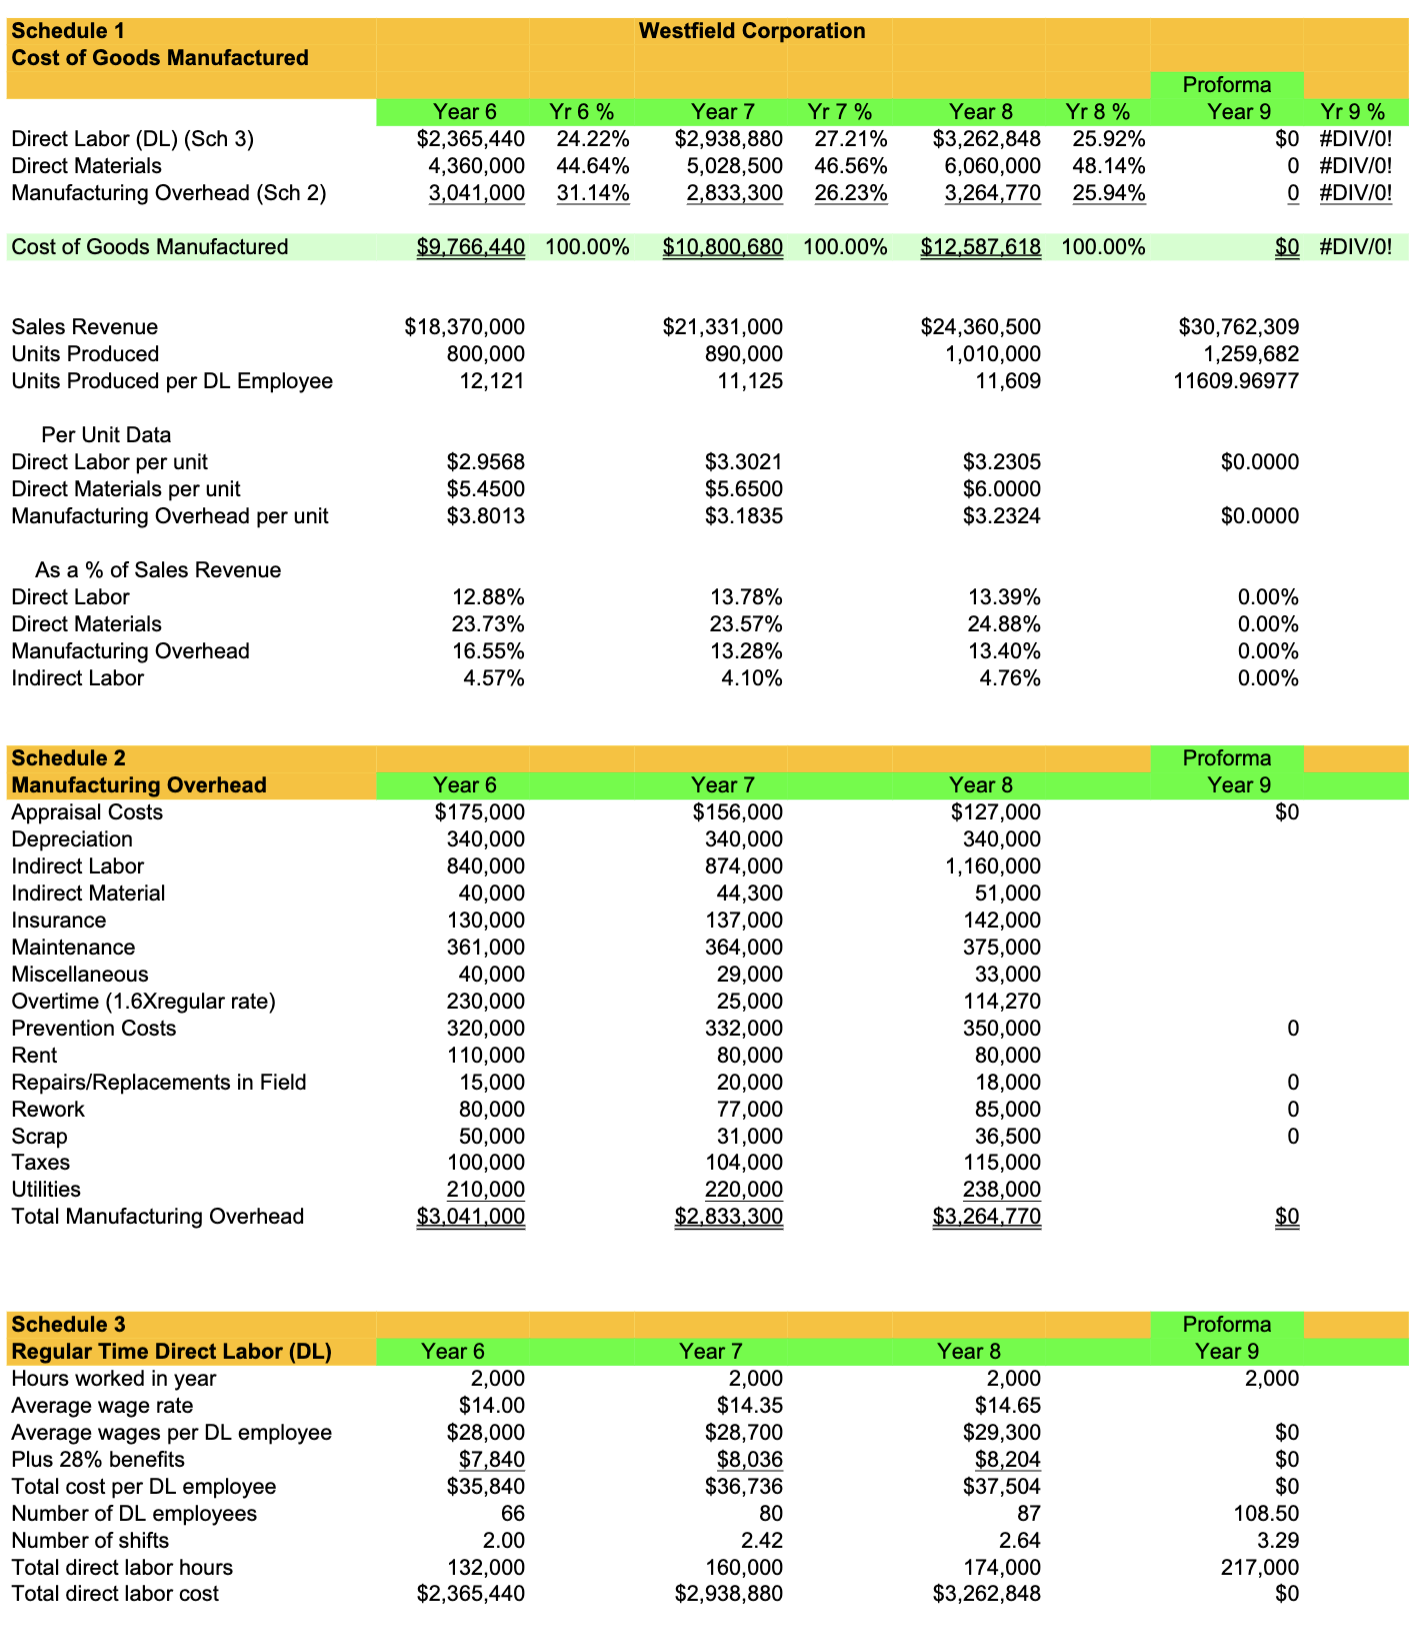
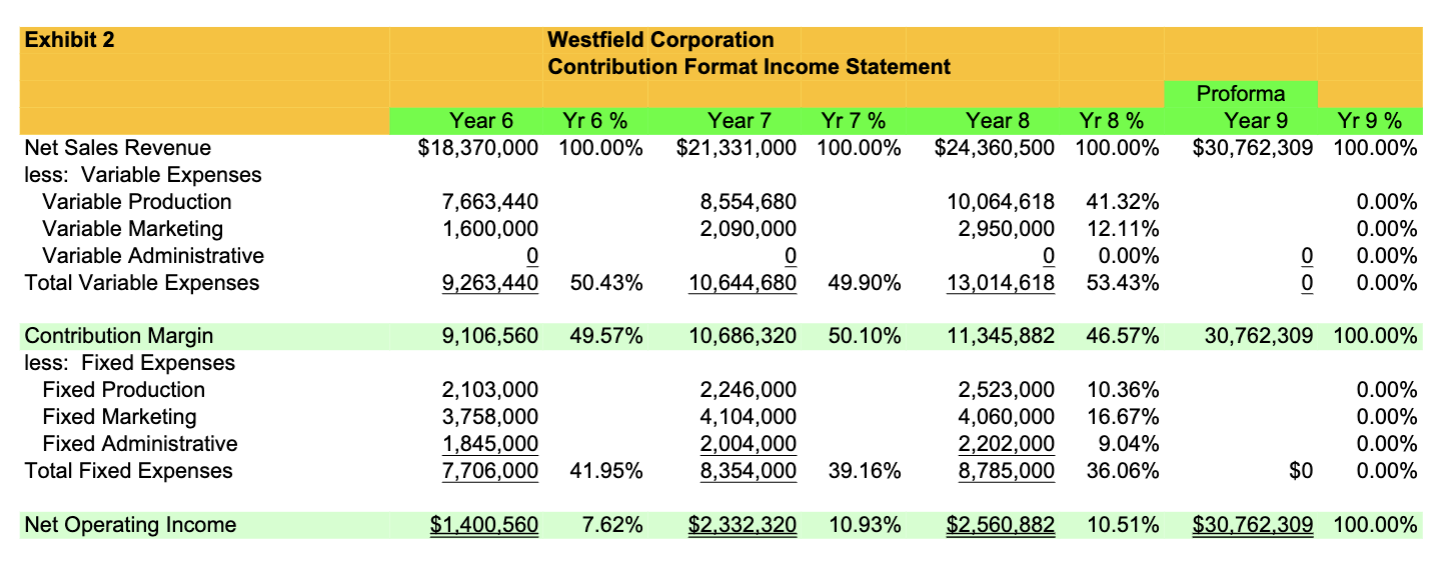
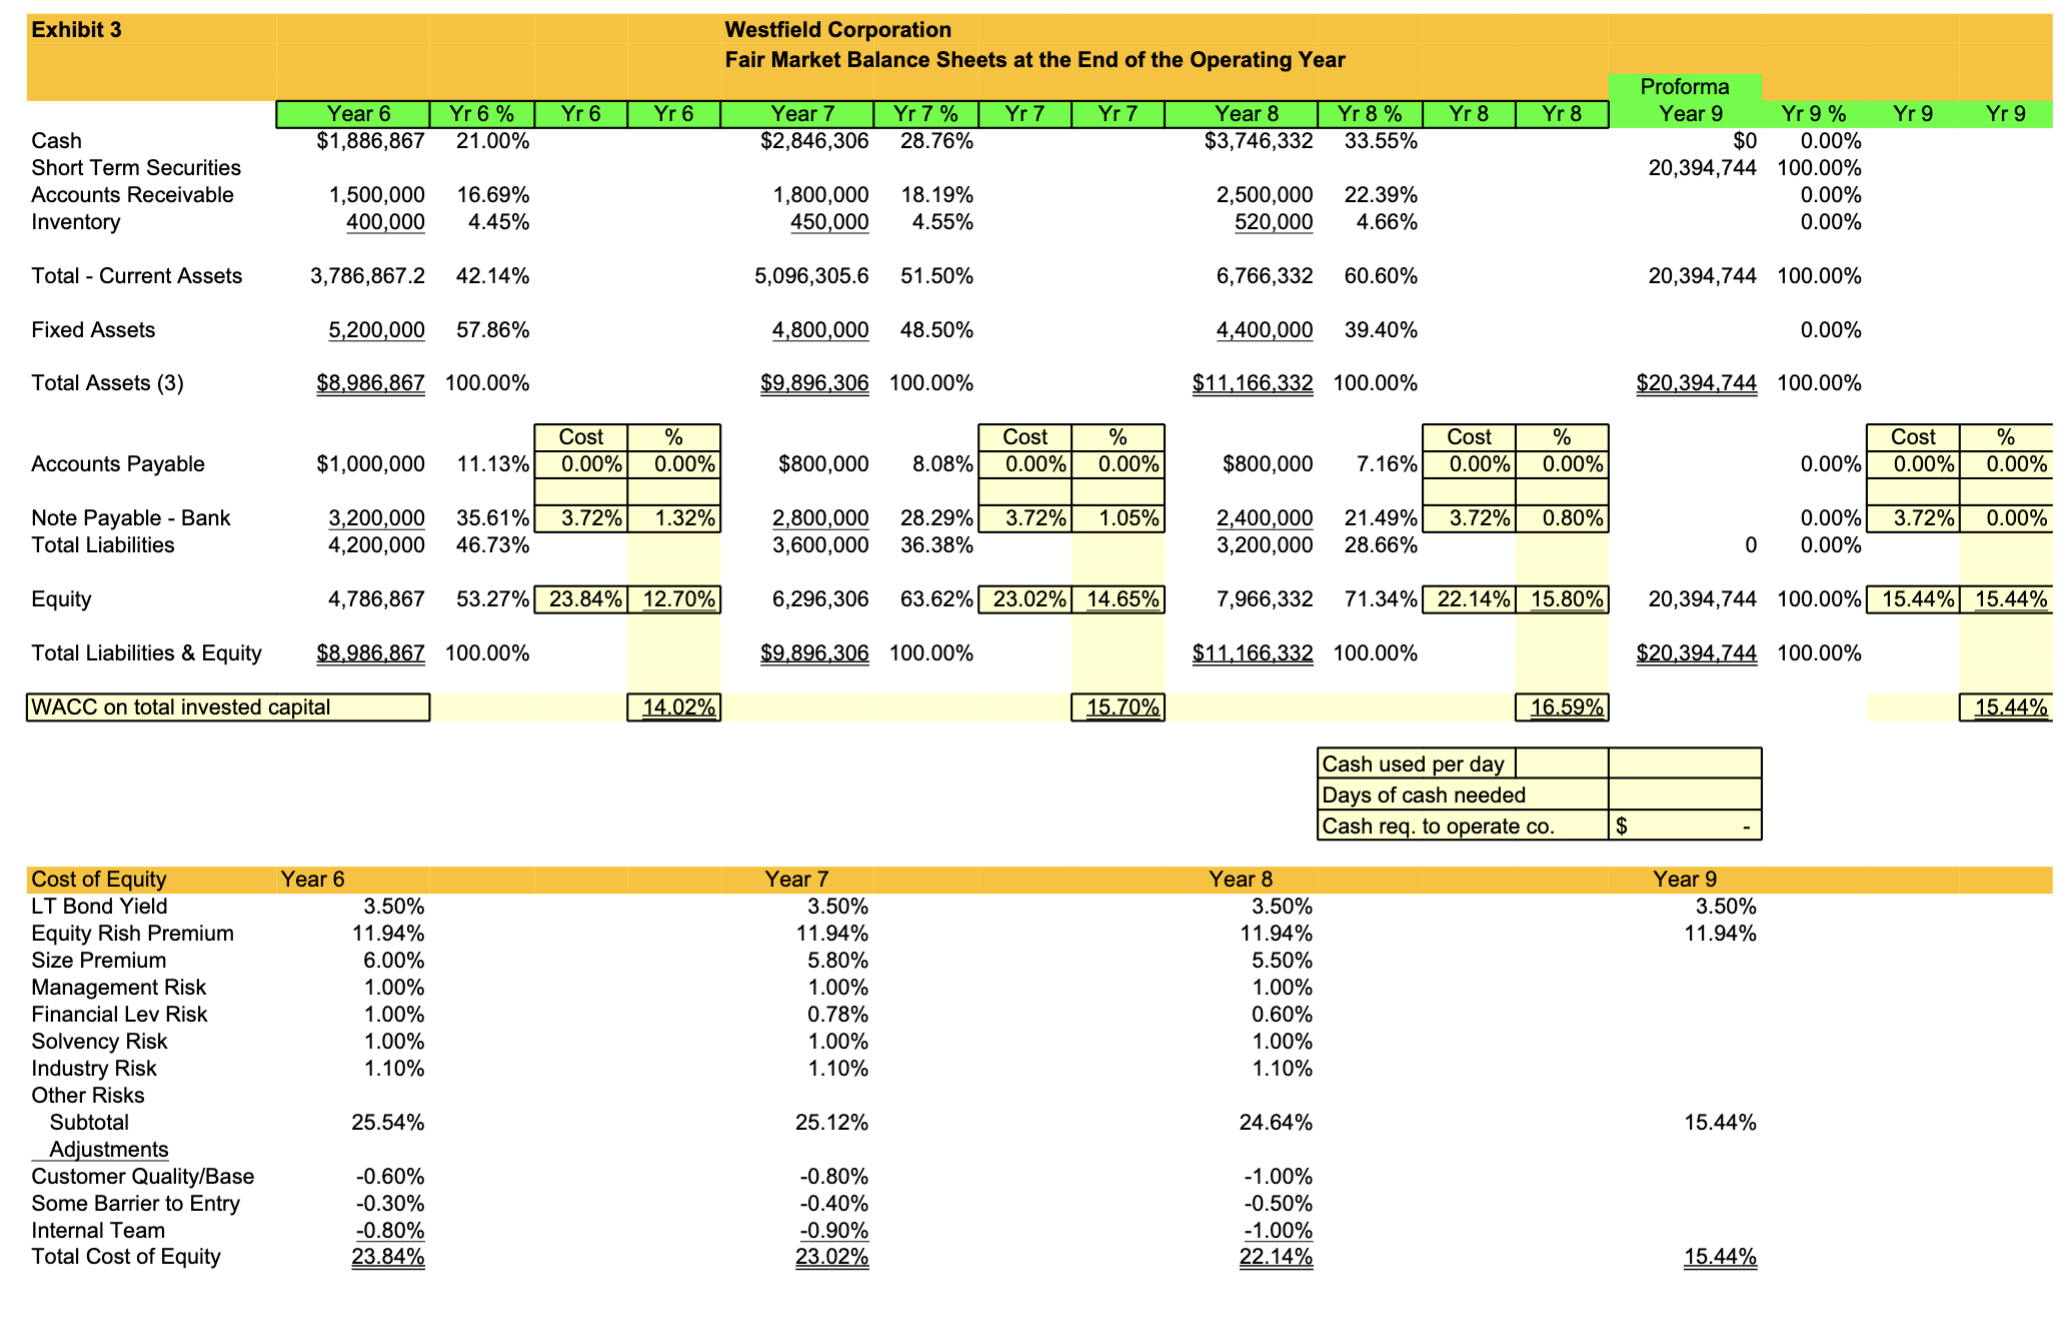
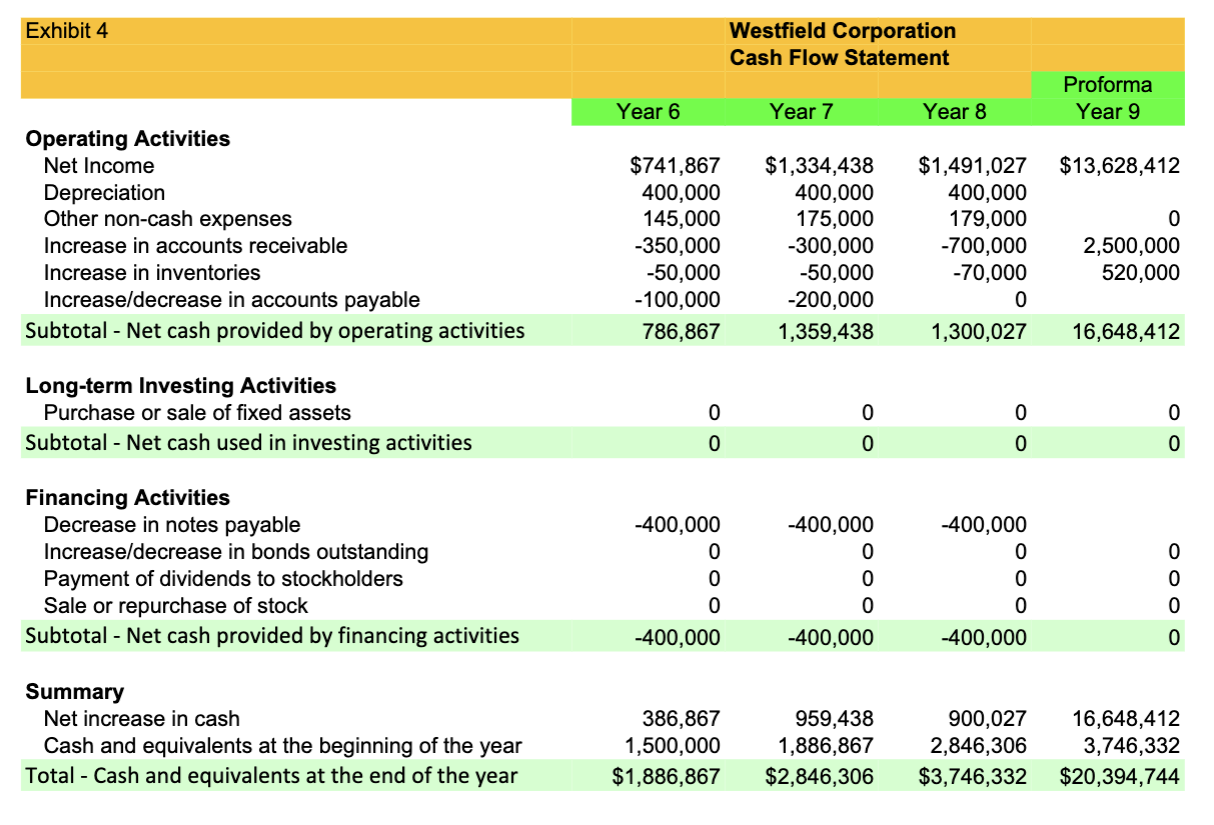
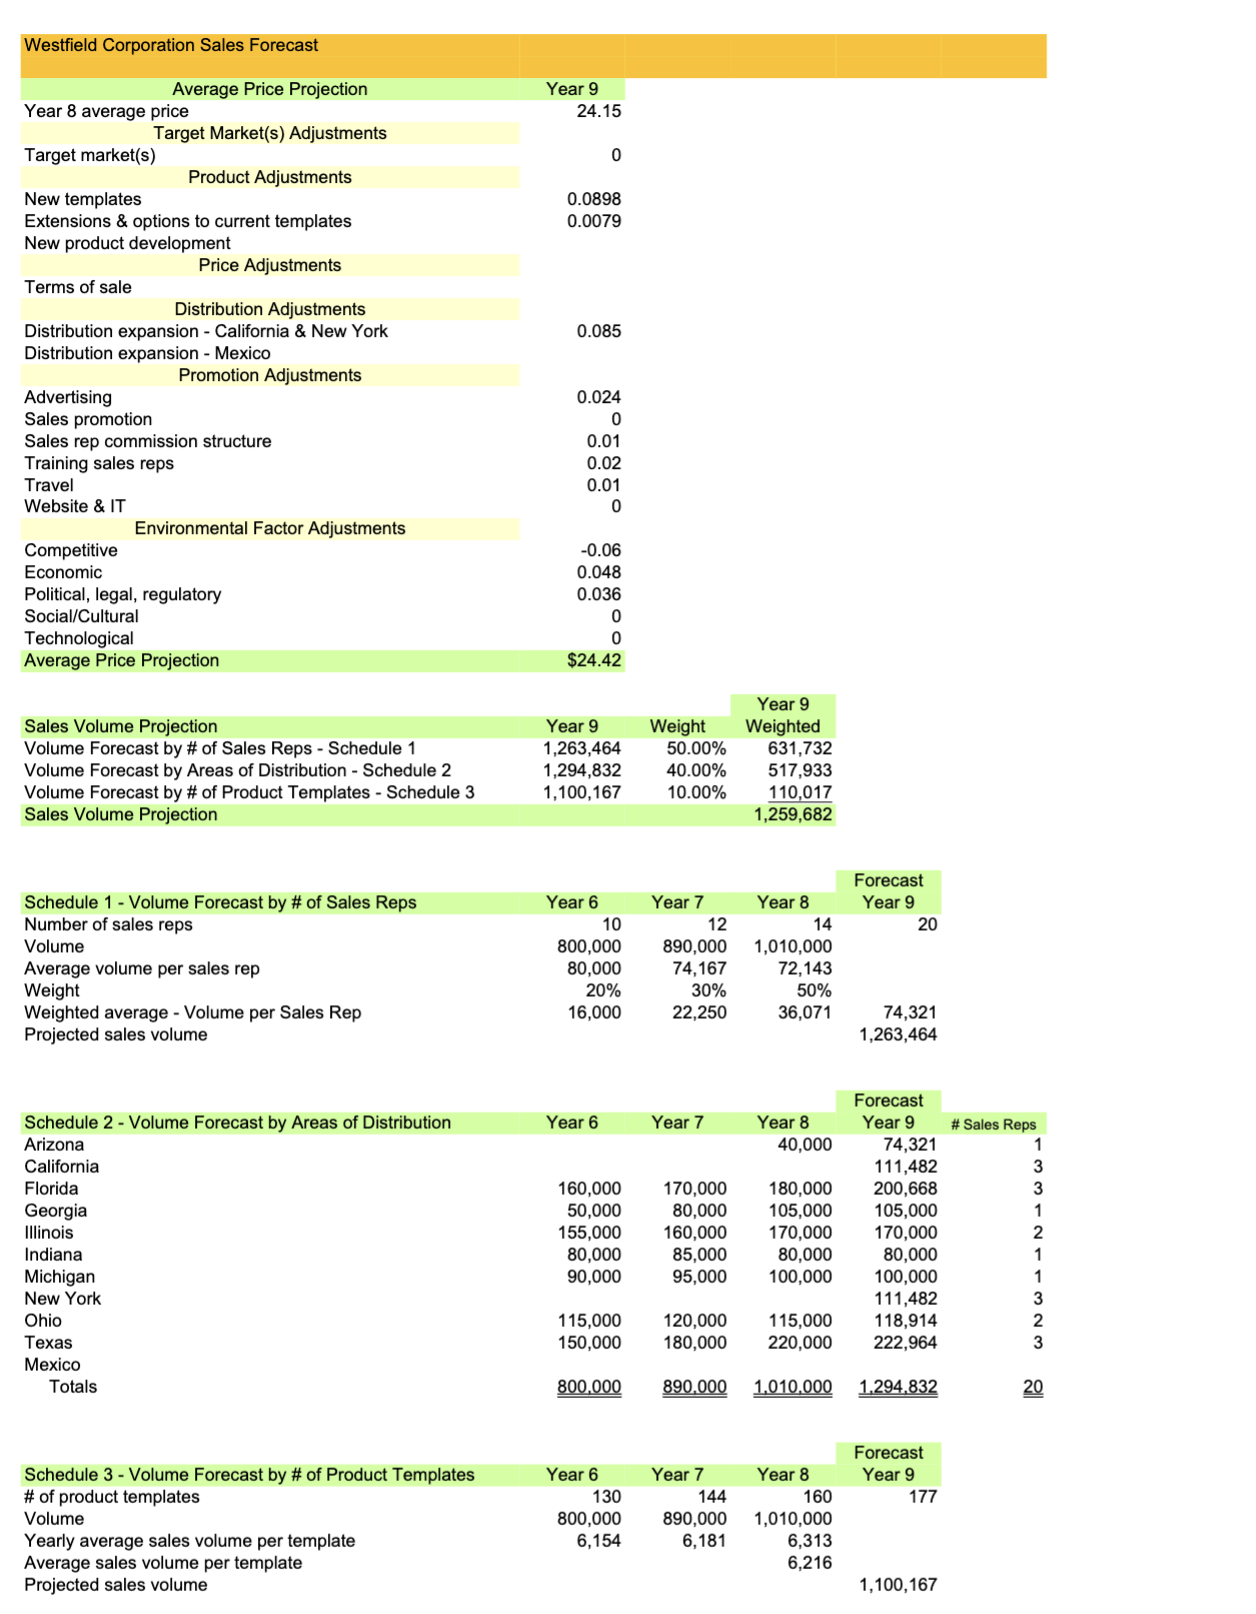
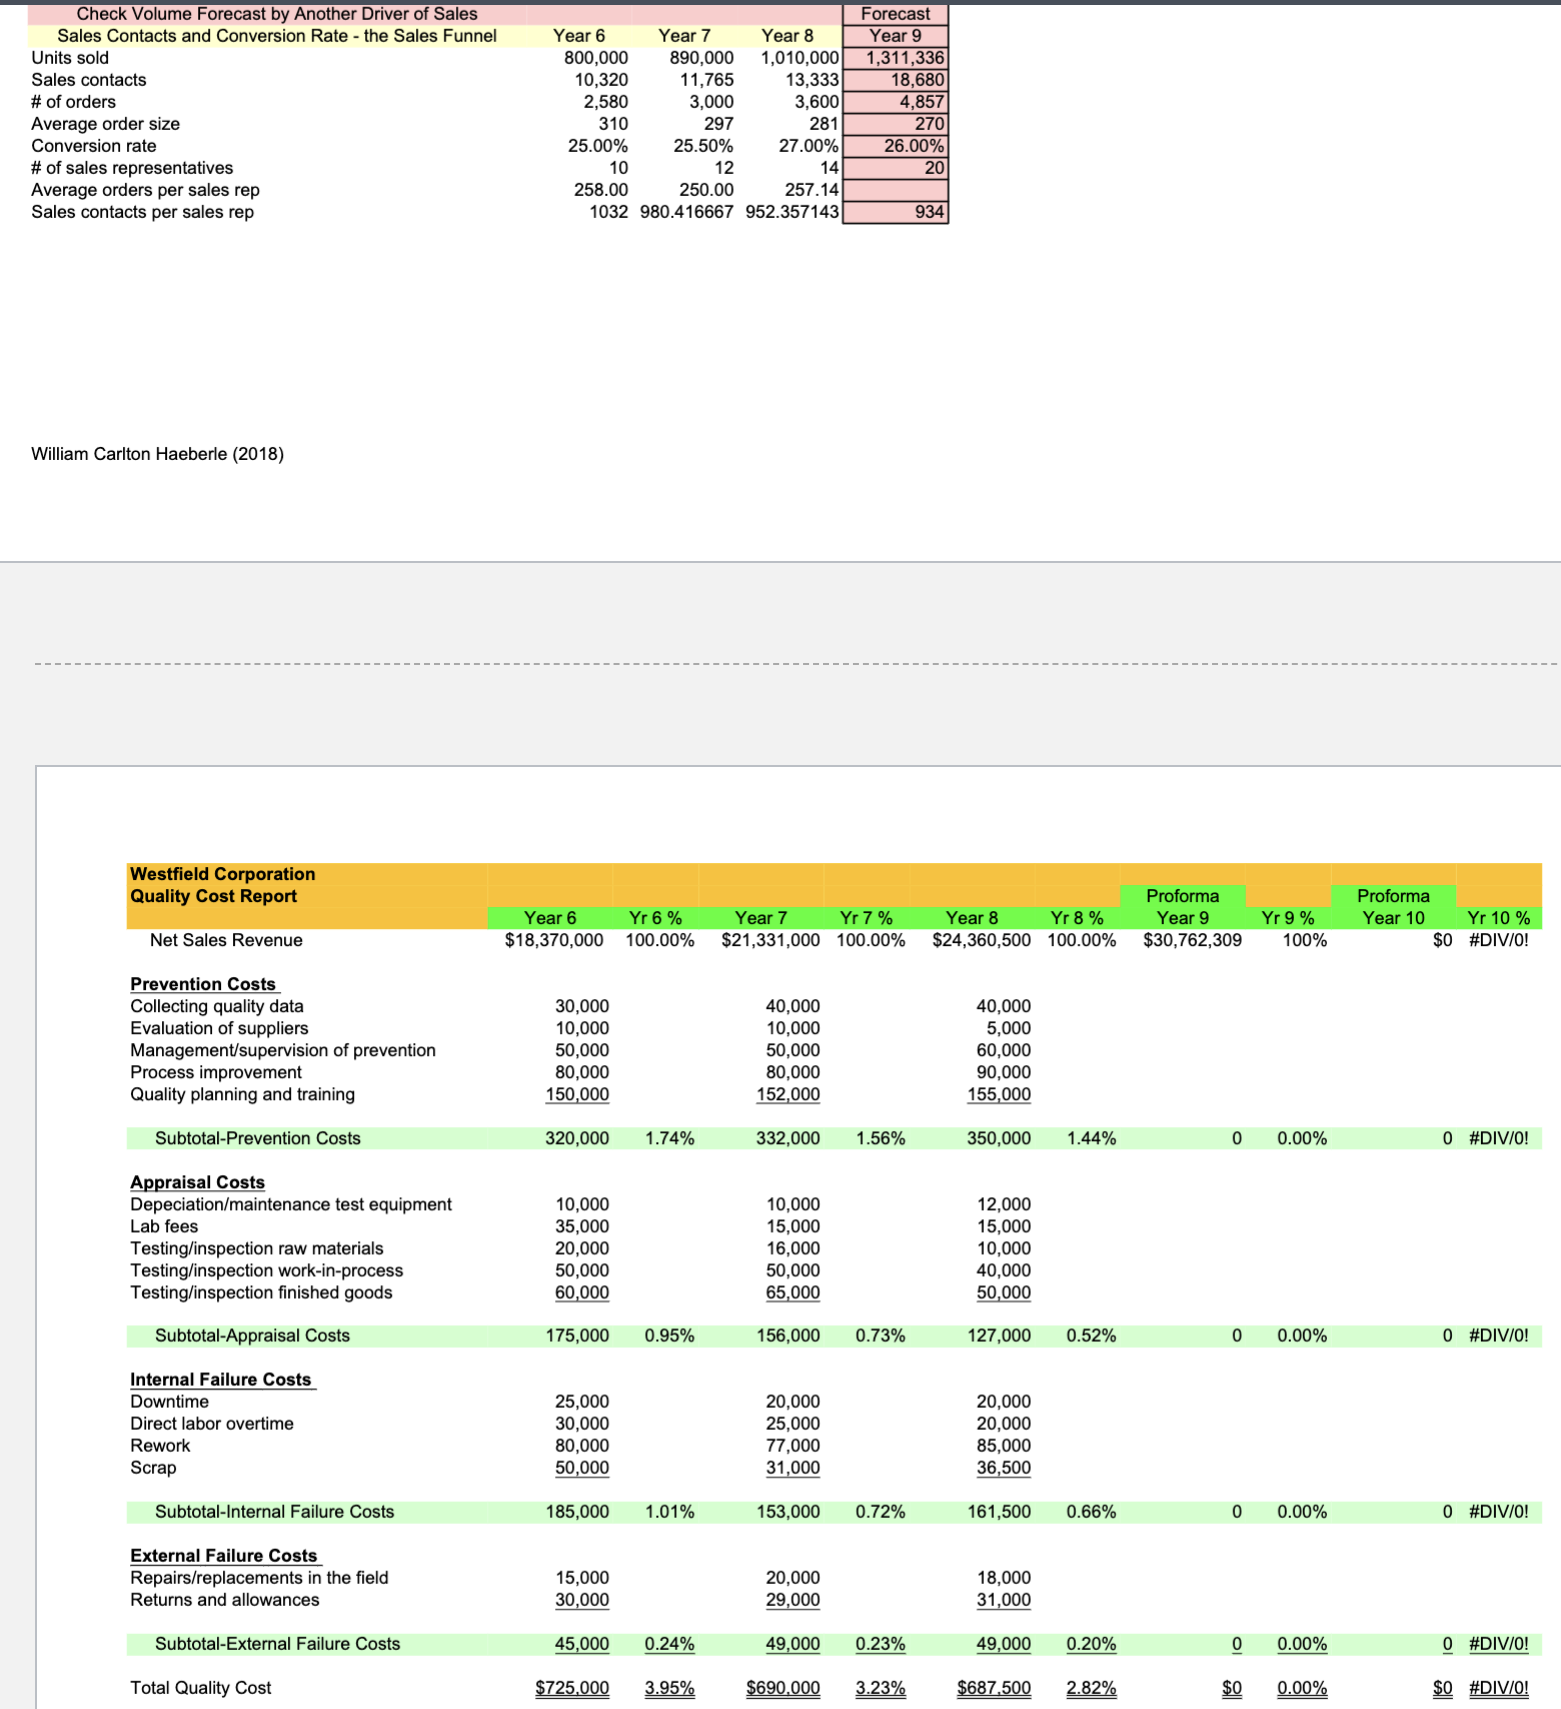
Use the Westfield Corporation Excel documents for questions 3 to 18. 16. Does the company classify "advertising" as a fixed, variable, or a mixed expense and why? Fixed but this is in error as advertising is a variable expense Fixed because sales vary with advertising expense Fixed because sales do not directly vary with advertising expense Variable because sales do not directly vary with advertising expense 18. Why is "net operating income" on the functional format income statement the same as "net operating income" on the contribution format income statement? Because sales are the same and the expenses total the same - the expenses are just organized in different ways - either by behavior or by function Because expenses are organized by behavior on the functional format income statement and by function on the contribution format income statement Just happened by chance Because sales are different and the expenses total is different and the expenses are organized in different ways - either by behavior or by function Question 19 0.5 pts Questions 19 and 20 are general questions (NOT about Westfield Corporation). 19. The trend for cost of goods sold is increasing as a percentage of sales and the trend for total marketing costs as a percentage of sales is decreasing. What does this suggest to the company CEO? The CEO would want to analyze whether marketing is pushing production to hard (increasing expenses) to make the marketing effort easier (less expenses). The CEO would want to analyze whether production is pushing marketing to hard to make the production effort easier and thus lower marketing expenses That production is spending too much money to produce the product That the marketing manager is doing a good job because marketing expenses are declining as a percentage of sales Questions 19 and 20 are general questions (NOT about Westfield Corporation). 20. What does the following scenario suggest to a company CEO? Sales in units are increasing and average price is decreasing. Net operating income is decreasing. The CEO should wait and hope things get better The extra volume is not making up for the lower price The CEO would want to carefully analyze the finance manager's work to ensure it is correct The CEO would want to check with the production manager on why this is happening \begin{tabular}{|c|c|c|c|c|c|c|c|} \hline \multirow[t]{3}{*}{ Exhibt 1} & \multirow[b]{3}{*}{ Year 6} & \multirow[b]{3}{*}{ Yr 6%} & \multicolumn{5}{|c|}{\begin{tabular}{l} Westfield Corporation \\ Functional Format Income Statements \end{tabular}} \\ \hline & & & & & & & Proforma \\ \hline & & & Year 7 & Yr 7% & Year 8 & Yr8% & Year 9 \\ \hline \# of Games Sold & 800,000 & & 890,000 & & 1,010,000 & & 1,259,682 \\ \hline Average Price per Game & $23.00 & & $24.00 & & $24.15 & & $24.42 \\ \hline Sales Revenue & $18,400,000 & 100.00% & $21,360,000 & 100.00% & $24,391,500 & 100.00% & $30,762,309 \\ \hline less: Returns \& Allowances & 30,000 & 0.16% & 29,000 & 0.14% & 31,000 & 0.13% & 0 \\ \hline Net Sales Revenue & 18,370,000 & 99.84% & 21,331,000 & 99.86% & 24,360,500 & 99.87% & 30,762,309 \\ \hline less: Cost of Goods Sold (Sch 1) & 9,766,440 & 53.08% & 10,800,680 & 50.56% & 12,587,618 & 51.61% & 0 \\ \hline Gross Margin & 8,603,560 & 46.76% & 10,530,320 & 49.30% & 11,772,882 & 48.27% & 30,762,309 \\ \hline less: Marketing Expenses (Sch 7) & 5,358,000 & 29.12% & 6,194,000 & 29.00% & 7,010,000 & 28.74% & 8,781,000 \\ \hline less: G \& A Expense (Sch 8) & 1,845,000 & 10.03% & 2,004,000 & 9.38% & 2,202,000 & 9.03% & \\ \hline Net Operating Income & 1,400,560 & 7.61% & 2,332,320 & 10.92% & 2,560,882 & 10.50% & 21,981,309 \\ \hline less: Other Expenses & 204,000 & 1.11% & 180,000 & 0.84% & 156,000 & 0.64% & \\ \hline Net Income Before Income Taxes & $1,196,560 & 6.50% & $2,152,320 & 10.08% & $2,404,882 & 9.86% & 21,981,309 \\ \hline less: Allowance for Income Taxes & 454,693 & 2.47% & 817,882 & 3.83% & 913,855 & 3.75% & 8,352,898 \\ \hline Net Income After Taxes & $741,867 & 4.03% & $1,334,438 & 6.25% & $1,491,027 & 6.11% & 13,628,412 \\ \hline \end{tabular} \begin{tabular}{|c|c|c|c|c|c|c|c|} \hline Schedule 7 - Marketing Expenses & & & & & & & Proforma \\ \hline & Year 6 & Yr 6% & Year 7 & Yr 7% & Year 8 & Yr 8% & Year 9 \\ \hline Advertising & $1,000,000 & 5.43% & $1,180,000 & 5.52% & $1,210,000 & 4.96% & $1,410,000 \\ \hline Allocated Overhead & 300,000 & 1.63% & 295,000 & 1.38% & 312,000 & 1.28% & 312,000 \\ \hline Depreciation & 30,000 & 0.16% & 30,000 & 0.14% & 30,000 & 0.12% & 30,000 \\ \hline Distribution Expansion Costs & 0 & 0.00% & 50,000 & 0.23% & 0 & 0.00% & 100,000 \\ \hline Other Expenses & 80,000 & 0.43% & 102,000 & 0.48% & 103,000 & 0.42% & 103,000 \\ \hline Research and Development & 600,000 & 3.26% & 550,000 & 2.57% & 580,000 & 2.38% & 620,000 \\ \hline Salaries \& Commissions & 2,000,000 & 10.87% & 2,490,000 & 11.66% & 2,900,000 & 11.89% & 3,746,000 \\ \hline Sales Promotion & 178,000 & 0.97% & 300,000 & 1.40% & 200,000 & 0.82% & 220,000 \\ \hline Supplies \& Equipment & 100,000 & 0.54% & 30,000 & 0.14% & 25,000 & 0.10% & 30,000 \\ \hline Training-Sales Reps & 200,000 & 1.09% & 160,000 & 0.75% & 400,000 & 1.64% & 520,000 \\ \hline Travel & 700,000 & 3.80% & 840,000 & 3.93% & 1,080,000 & 4.43% & 1,520,000 \\ \hline Website \& IT & 170,000 & 0.92% & 167,000 & 0.78% & 170,000 & 0.70% & 170,000 \\ \hline Total Marketing Expenses & $5,358,000 & 29.12% & $6,194,000 & 29.00% & $7,010,000 & 28.74% & $8,781,000 \\ \hline \end{tabular} Schedule 8 - General \& Administrative Expenses Proforma \begin{tabular}{|c|c|c|c|c|c|c|c|c|} \hline \multirow{2}{*}{\begin{tabular}{l} Schedule 1 \\ Cost of Goods Manufactured \end{tabular}} & \multirow[b]{2}{*}{ Year 6} & \multirow[b]{2}{*}{ Yr 6%} & \multicolumn{2}{|c|}{ Westfield Corporation } & \multirow[b]{2}{*}{ Year 8} & \multirow[b]{2}{*}{ Yr 8%} & \multirow[b]{2}{*}{\begin{tabular}{r} Proforma \\ Year 9 \end{tabular}} & \multirow[b]{2}{*}{ Yr 9%} \\ \hline & & & Year 7 & Yr 7% & & & & \\ \hline Direct Labor (DL) (Sch 3) & $2,365,440 & 24.22% & $2,938,880 & 27.21% & $3,262,848 & 25.92% & $0 & \#DIV/0! \\ \hline Direct Materials & 4,360,000 & 44.64% & 5,028,500 & 46.56% & 6,060,000 & 48.14% & 0 & \#DIV/0! \\ \hline Manufacturing Overhead (Sch 2) & 3,041,000 & 31.14% & 2,833,300 & 26.23% & 3,264,770 & 25.94% & 0 & \#DIV/0! \\ \hline Cost of Goods Manufactured & $9,766,440 & 100.00% & $10,800,680 & 100.00% & $12,587,618 & 100.00% & $0 & \#DIV/0! \\ \hline Sales Revenue & $18,370,000 & & $21,331,000 & & $24,360,500 & & $30,762,309 & \\ \hline Units Produced & 800,000 & & 890,000 & & 1,010,000 & & 1,259,682 & \\ \hline Units Produced per DL Employee & 12,121 & & 11,125 & & 11,609 & & 11609.96977 & \\ \hline \multicolumn{9}{|l|}{ Per Unit Data } \\ \hline Direct Labor per unit & $2.9568 & & $3.3021 & & $3.2305 & & $0.0000 & \\ \hline Direct Materials per unit & $5.4500 & & $5.6500 & & $6.0000 & & & \\ \hline Manufacturing Overhead per unit & $3.8013 & & $3.1835 & & $3.2324 & & $0.0000 & \\ \hline \multicolumn{9}{|l|}{ As a % of Sales Revenue } \\ \hline Direct Labor & 12.88% & & 13.78% & & 13.39% & & 0.00% & \\ \hline Direct Materials & 23.73% & & 23.57% & & 24.88% & & 0.00% & \\ \hline Manufacturing Overhead & 16.55% & & 13.28% & & 13.40% & & 0.00% & \\ \hline Indirect Labor & 4.57% & & 4.10% & & 4.76% & & 0.00% & \\ \hline \end{tabular} \begin{tabular}{|c|c|c|c|c|} \hline \begin{tabular}{l} Schedule 2 \\ Manufacturing Overhead \end{tabular} & Year 6 & Year 7 & Year 8 & \begin{tabular}{l} Proforma \\ Year 9 \end{tabular} \\ \hline Appraisal Costs & $175,000 & $156,000 & $127,000 & $0 \\ \hline Depreciation & 340,000 & 340,000 & 340,000 & \\ \hline Indirect Labor & 840,000 & 874,000 & 1,160,000 & \\ \hline Indirect Material & 40,000 & 44,300 & 51,000 & \\ \hline Insurance & 130,000 & 137,000 & 142,000 & \\ \hline Maintenance & 361,000 & 364,000 & 375,000 & \\ \hline Miscellaneous & 40,000 & 29,000 & 33,000 & \\ \hline Overtime (1.6Xregular rate) & 230,000 & 25,000 & 114,270 & \\ \hline Prevention Costs & 320,000 & 332,000 & 350,000 & 0 \\ \hline Rent & 110,000 & 80,000 & 80,000 & \\ \hline Repairs/Replacements in Field & 15,000 & 20,000 & 18,000 & 0 \\ \hline Rework & 80,000 & 77,000 & 85,000 & 0 \\ \hline Scrap & 50,000 & 31,000 & 36,500 & 0 \\ \hline Taxes & 100,000 & 104,000 & 115,000 & \\ \hline Utilities & 210,000 & 220,000 & 238,000 & \\ \hline Total Manufacturing Overhead & $3,041,000 & $2,833,300 & $3,264,770 & $0 \\ \hline \end{tabular} \begin{tabular}{lrrrr} Schedule 3 & \multicolumn{3}{c}{ Proforma } \\ Regular Time Direct Labor (DL) & \multicolumn{1}{c}{ Year 6 } & Year 7 & \multicolumn{1}{c}{ Year 9 } \\ Hours worked in year & 2,000 & 2,000 & 2,000 & 2,000 \\ Average wage rate & $14.00 & $14.35 & $14.65 & \\ Average wages per DL employee & $28,000 & $28,700 & $29,300 & \\ Plus 28\% benefits & $7,840 & $8,036 & $8,204 & $0 \\ Total cost per DL employee & $35,840 & $36,736 & $37,504 & 87 \\ Number of DL employees & 66 & 80 & 2.64 & 108.50 \\ Number of shifts & 2.00 & 2.42 & 174,000 & 3.29 \\ Total direct labor hours & 132,000 & 160,000 & $3,262,848 & $000 \\ Total direct labor cost & $2,365,440 & $2,938,880 & \end{tabular} \begin{tabular}{|c|c|c|c|c|c|c|c|c|} \hline \multirow[t]{2}{*}{ Exhibit 2} & \multicolumn{5}{|c|}{\begin{tabular}{l} Westfield Corporation \\ Contribution Format Income Statement \end{tabular}} & \multirow[b]{2}{*}{ Yr 8%} & \multirow{2}{*}{ Proforma } & \multirow[b]{2}{*}{Yr9%} \\ \hline & Year 6 & Yr6% & Year 7 & Yr7% & Year 8 & & & \\ \hline \begin{tabular}{l} Net Sales Revenue \\ less: Variable Expenses \end{tabular} & $18,370,000 & 100.00% & $21,331,000 & 100.00% & $24,360,500 & 100.00% & $30,762,309 & 100.00% \\ \hline Variable Production & 7,663,440 & & 8,554,680 & & 10,064,618 & 41.32% & & 0.00% \\ \hline Variable Marketing & 1,600,000 & & 2,090,000 & & 2,950,000 & 12.11% & & 0.00% \\ \hline Variable Administrative & 0 & & 0 & & 0 & 0.00% & 0 & 0.00% \\ \hline Total Variable Expenses & 9,263,440 & 50.43% & 10,644,680 & 49.90% & 13,014,618 & 53.43% & 0 & 0.00% \\ \hline Contribution Margin & 9,106,560 & 49.57% & 10,686,320 & 50.10% & 11,345,882 & 46.57% & 30,762,309 & 100.00% \\ \hline less: Fixed Expenses & & & & & & & & \\ \hline Fixed Production & 2,103,000 & & 2,246,000 & & 2,523,000 & 10.36% & & 0.00% \\ \hline Fixed Marketing & 3,758,000 & & 4,104,000 & & 4,060,000 & 16.67% & & 0.00% \\ \hline Fixed Administrative & 1,845,000 & & 2,004,000 & & 2,202,000 & 9.04% & & 0.00% \\ \hline Total Fixed Expenses & 7,706,000 & 41.95% & 8,354,000 & 39.16% & 8,785,000 & 36.06% & $0 & 0.00% \\ \hline Net Operating Income & $1,400,560 & 7.62% & $2,332,320 & 10.93% & $2,560,882 & 10.51% & $30,762,309 & 100.00% \\ \hline \end{tabular} Westfield Corporation \begin{tabular}{|c|c|c|c|c|} \hline \multirow[t]{2}{*}{ Exhibit 4} & \multicolumn{3}{|c|}{\begin{tabular}{l} Westfield Corporation \\ Cash Flow Statement \end{tabular}} & \multirow[b]{2}{*}{\begin{tabular}{l} Proforma \\ Year 9 \end{tabular}} \\ \hline & Year 6 & Year 7 & Year 8 & \\ \hline \multicolumn{5}{|l|}{ Operating Activities } \\ \hline Net Income & $741,867 & $1,334,438 & $1,491,027 & $13,628,412 \\ \hline Depreciation & 400,000 & 400,000 & 400,000 & \\ \hline Other non-cash expenses & 145,000 & 175,000 & 179,000 & 0 \\ \hline Increase in accounts receivable & 350,000 & 300,000 & 700,000 & 2,500,000 \\ \hline Increase in inventories & 50,000 & 50,000 & 70,000 & 520,000 \\ \hline Increase/decrease in accounts payable & 100,000 & 200,000 & 0 & \\ \hline Subtotal - Net cash provided by operating activities & 786,867 & 1,359,438 & 1,300,027 & 16,648,412 \\ \hline \multicolumn{5}{|l|}{ Long-term Investing Activities } \\ \hline Purchase or sale of fixed assets & 0 & 0 & 0 & 0 \\ \hline Subtotal - Net cash used in investing activities & 0 & 0 & 0 & 0 \\ \hline \multicolumn{5}{|l|}{ Financing Activities } \\ \hline Decrease in notes payable & 400,000 & 400,000 & 400,000 & \\ \hline Increase/decrease in bonds outstanding & 0 & 0 & 0 & 0 \\ \hline Payment of dividends to stockholders & 0 & 0 & 0 & 0 \\ \hline Sale or repurchase of stock & 0 & 0 & 0 & 0 \\ \hline Subtotal - Net cash provided by financing activities & 400,000 & 400,000 & 400,000 & 0 \\ \hline \multicolumn{5}{|l|}{ Summary } \\ \hline Net increase in cash & 386,867 & 959,438 & 900,027 & 16,648,412 \\ \hline Cash and equivalents at the beginning of the year & 1,500,000 & 1,886,867 & 2,846,306 & 3,746,332 \\ \hline Total - Cash and equivalents at the end of the year & $1,886,867 & $2,846,306 & $3,746,332 & $20,394,744 \\ \hline \end{tabular} Westfield Corporation Sales Forecast Average Price Projection Year 8 average price Target Market(s) Adjustments Target market(s) Product Adjustments New templates Extensions \& options to current templates New product development Price Adjustments Terms of sale Distribution Adjustments Distribution expansion - California \& New York Distribution expansion - Mexico Promotion Adjustments Advertising Sales promotion Sales rep commission structure Training sales reps Travel Website \& IT Environmental Factor Adjustments Competitive Economic Political, legal, regulatory Social/Cultural Technological Average Price Projection Year 9 24.15 0 0.0898 0.0079 0.085 0.024 0 0.01 0.02 0.01 0 0.06 0.048 0.036 0 $24.42 \begin{tabular}{lrrr} & & & \multicolumn{1}{c}{ Year 9 } \\ Sales Volume Projection & Year 9 & Weight & \multicolumn{1}{c}{ Weighted } \\ Volume Forecast by \# of Sales Reps - Schedule 1 & 1,263,464 & 50.00% & 631,732 \\ Volume Forecast by Areas of Distribution - Schedule 2 & 1,294,832 & 40.00% & 517,933 \\ Volume Forecast by \# of Product Templates - Schedule 3 & 1,100,167 & 10.00% & 110,017 \\ Sales Volume Projection & & & 1,259,682 \end{tabular} Schedule 1 - Volume Forecast by \# of Sales Reps Number of sales reps Volume Average volume per sales rep Weight Weighted average - Volume per Sales Rep Projected sales volume \begin{tabular}{|c|c|c|c|} \hline Year 6 & Year 7 & Year 8 & \begin{tabular}{c} Forecast \\ Year 9 \end{tabular} \\ \hline 10 & 12 & 14 & 20 \\ \hline 800,000 & 890,000 & 1,010,000 & \\ \hline 80,000 & 74,167 & 72,143 & \\ \hline 20% & 30% & 50% & \\ \hline 16,000 & 22,250 & 36,071 & \begin{tabular}{r} 74,321 \\ 1,263,464 \end{tabular} \\ \hline \end{tabular} Schedule 2 - Volume Forecast by Areas of Distribution Arizona California Florida Georgia Illinois Indiana Michigan New York Ohio Texas Mexico Totals \begin{tabular}{|c|c|c|c|c|} \hline Year 6 & Year 7 & Year 8 & \begin{tabular}{c} Forecast \\ Year 9 \end{tabular} & \# Sales Reps \\ \hline & & 40,000 & 74,321 & 1 \\ \hline & & & 111,482 & 3 \\ \hline 160,000 & 170,000 & 180,000 & 200,668 & 3 \\ \hline 50,000 & 80,000 & 105,000 & 105,000 & 1 \\ \hline 155,000 & 160,000 & 170,000 & 170,000 & 2 \\ \hline 80,000 & 85,000 & 80,000 & 80,000 & 1 \\ \hline \multirow[t]{2}{*}{90,000} & 95,000 & 100,000 & 100,000 & 1 \\ \hline & & & 111,482 & 3 \\ \hline 115,000 & 120,000 & 115,000 & 118,914 & 2 \\ \hline 150,000 & 180,000 & 220,000 & 222,964 & 3 \\ \hline 800,000 & 890,000 & 1.010,000 & 1.294,832 & 20 \\ \hline \end{tabular} Schedule 3 - Volume Forecast by \# of Product Templates \# of product templates Volume Yearly average sales volume per template Average sales volume per template Projected sales volume \begin{tabular}{rrrr} \multicolumn{1}{r|r}{ Year 6 } & \multicolumn{1}{c}{ Forecast } \\ 130 & 144 & 160 & 177 \\ 800,000 & 890,000 & 1,010,000 & \\ 6,154 & 6,181 & 6,313 & \\ & & 6,216 & \\ & & & 1,100,167 \end{tabular} William Carlton Haeberle (2018)
Step by Step Solution
There are 3 Steps involved in it

Get step-by-step solutions from verified subject matter experts