

Question: Please answer all three parts and do not copy answers available on chegg. Label and compute the necessary data needed to calculate the upper and
Please answer all three parts and do not copy answers available on chegg.
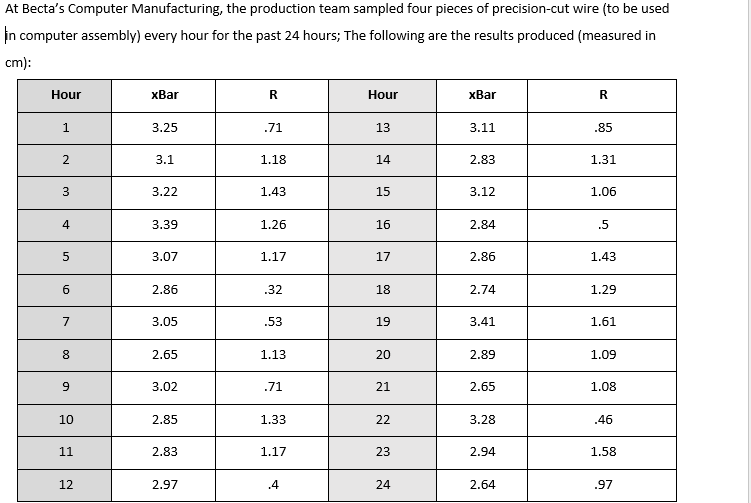
- Label and compute the necessary data needed to calculate the upper and lower limits for the xBar and the R charts.
- Develop the xBar and the R charts.
- Plot the information and look for patterns. Determine and explain whether there is any cause for concern in the cutting process.
Step by Step Solution
There are 3 Steps involved in it
1 Expert Approved Answer
Step: 1 Unlock

Question Has Been Solved by an Expert!
Get step-by-step solutions from verified subject matter experts
Step: 2 Unlock
Step: 3 Unlock