Question: AutoSave OFF A S U = w SPC-ResponseTime - Saved to my Mac Home Insert Draw Design Layout References Mailings Review View >> Share Comments
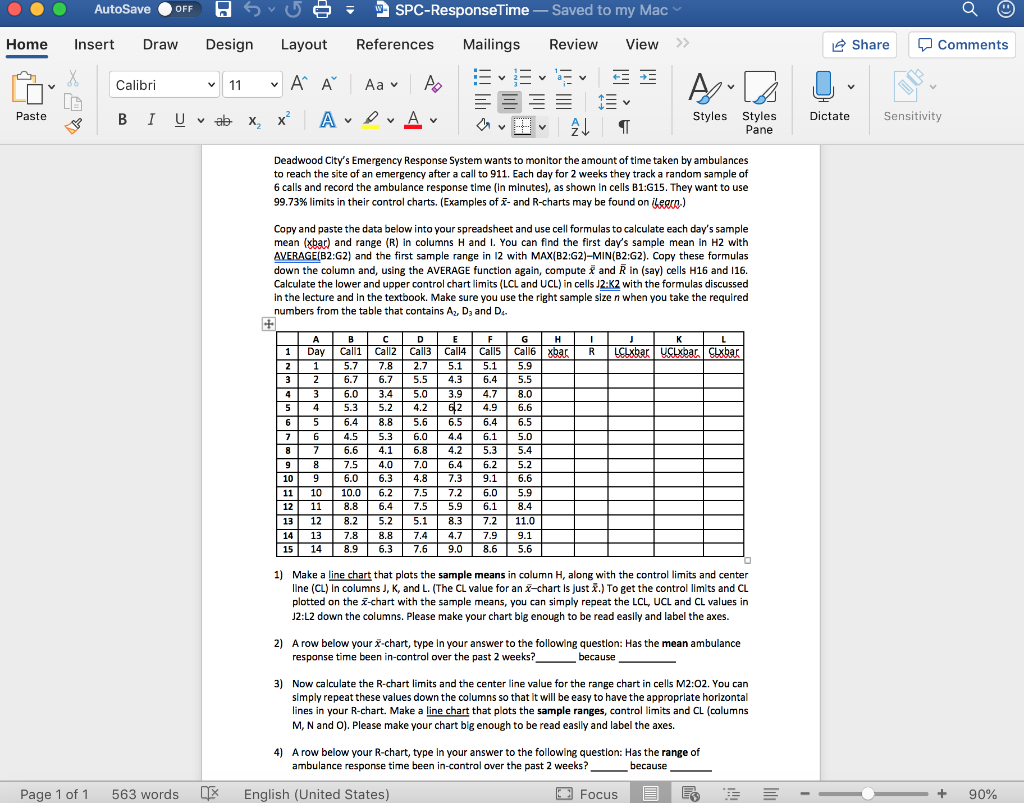
AutoSave OFF A S U = w SPC-ResponseTime - Saved to my Mac Home Insert Draw Design Layout References Mailings Review View >> Share Comments Suv Calibri 11 A A Aa A 8 B 1 Uvab X, X ADA Paste Styles Styles Pane Dictate Sensitivity AL Deadwood City's Emergency Response System wants to monitor the amount of time taken by ambulances to reach the site of an emergency after a call to 911. Each day for 2 weeks they track a random sample of 6 calls and record the ambulance response time (in minutes), as shown in cells B1:G15. They want to use 99.73% limits in their control charts. (Examples of - and R-charts may be found on legrn) Copy and paste the data below into your spreadsheet and use cell formulas to calculate each day's sample mean (xbar) and range (R) in columns H and I. You can find the first day's sample mean in H2 with AVERAGE(B2:G2) and the first sample range in 12 with MAX(B2:42)-MIN(B2:32). Copy these formulas down the column and, using the AVERAGE function again, compute and Rin (say) cells H16 and 116. Calculate the lower and upper control chart limits (LCL and UCL) in cells J2:K2 with the formulas discussed In the lecture and in the textbook. Make sure you use the right sample size n when you take the required numbers from the table that contains A, D, and D. ABCDEFGHIJKL 1 Day Calli | Call Call Call Call Call6xbar R LCLxbar UcLxbar. clxbar 1 5 .7 7.8 2.7 5.1 5.1 5.9 2 6 .7 6.7 5.5 4.3 6.4 5.5 6.0 3. 4 5 .0 3.9 4.7 8.0 | 5 4 5.3 5.2 4.2 62 4.9 6.6 6 5 6.4 8.8 5.6 6.5 6.4 6.5 6 4.5 5.3 6.0 4.4 6.1 5.0 81 7 6.6 4.1 6.8 4.2 5.3 5.4 9 8 7.5 4.0 7.0 6.4 6. 25 .2 109 6.0 6. 34. 87. 39. 16.6 11 10 10. 06. 27. 57. 26.0 5.9 12 11 8 .8 6.4 7.5 5.9 6.1 8.4 13 12 8.2 5.2 5.1 8. 3 7 .2 11.0 14 13 7.8 8.8 7.4 4.7 7.9 9.1 15 14 8.9 6.3 7.6 9.0 8.6 5.6 1) Make a line chart that plots the sample means in column H, along with the control limits and center line (CL) in columns J, K, and L. (The CL value for an X-chart is just X.) To get the control limits and CL plotted on the Z-chart with the sample means, you can simply repeat the LCL, UCL and CL values in J2:L2 down the columns. Please make your chart big enough to be read easily and label the axes. 2) A row below your x-chart, type in your answer to the following question: Has the mean ambulance response time been in-control over the past 2 weeks? because 3) Now calculate the R-chart limits and the center line value for the range chart in cells M2:02. You can simply repeat these values down the columns so that it will be easy to have the appropriate horizontal lines in your R-chart. Make a line chart that plots the sample ranges, control limits and CL (columns M, N and O). Please make your chart big enough to be read easily and label the axes. 4) A row below your R-chart, type in your answer to the following question: Has the range of ambulance response time been in-control over the past 2 weeks? - because Page 1 of 1 563 words English (United States) O Focus E + 90% AutoSave OFF A S U = w SPC-ResponseTime - Saved to my Mac Home Insert Draw Design Layout References Mailings Review View >> Share Comments Suv Calibri 11 A A Aa A 8 B 1 Uvab X, X ADA Paste Styles Styles Pane Dictate Sensitivity AL Deadwood City's Emergency Response System wants to monitor the amount of time taken by ambulances to reach the site of an emergency after a call to 911. Each day for 2 weeks they track a random sample of 6 calls and record the ambulance response time (in minutes), as shown in cells B1:G15. They want to use 99.73% limits in their control charts. (Examples of - and R-charts may be found on legrn) Copy and paste the data below into your spreadsheet and use cell formulas to calculate each day's sample mean (xbar) and range (R) in columns H and I. You can find the first day's sample mean in H2 with AVERAGE(B2:G2) and the first sample range in 12 with MAX(B2:42)-MIN(B2:32). Copy these formulas down the column and, using the AVERAGE function again, compute and Rin (say) cells H16 and 116. Calculate the lower and upper control chart limits (LCL and UCL) in cells J2:K2 with the formulas discussed In the lecture and in the textbook. Make sure you use the right sample size n when you take the required numbers from the table that contains A, D, and D. ABCDEFGHIJKL 1 Day Calli | Call Call Call Call Call6xbar R LCLxbar UcLxbar. clxbar 1 5 .7 7.8 2.7 5.1 5.1 5.9 2 6 .7 6.7 5.5 4.3 6.4 5.5 6.0 3. 4 5 .0 3.9 4.7 8.0 | 5 4 5.3 5.2 4.2 62 4.9 6.6 6 5 6.4 8.8 5.6 6.5 6.4 6.5 6 4.5 5.3 6.0 4.4 6.1 5.0 81 7 6.6 4.1 6.8 4.2 5.3 5.4 9 8 7.5 4.0 7.0 6.4 6. 25 .2 109 6.0 6. 34. 87. 39. 16.6 11 10 10. 06. 27. 57. 26.0 5.9 12 11 8 .8 6.4 7.5 5.9 6.1 8.4 13 12 8.2 5.2 5.1 8. 3 7 .2 11.0 14 13 7.8 8.8 7.4 4.7 7.9 9.1 15 14 8.9 6.3 7.6 9.0 8.6 5.6 1) Make a line chart that plots the sample means in column H, along with the control limits and center line (CL) in columns J, K, and L. (The CL value for an X-chart is just X.) To get the control limits and CL plotted on the Z-chart with the sample means, you can simply repeat the LCL, UCL and CL values in J2:L2 down the columns. Please make your chart big enough to be read easily and label the axes. 2) A row below your x-chart, type in your answer to the following question: Has the mean ambulance response time been in-control over the past 2 weeks? because 3) Now calculate the R-chart limits and the center line value for the range chart in cells M2:02. You can simply repeat these values down the columns so that it will be easy to have the appropriate horizontal lines in your R-chart. Make a line chart that plots the sample ranges, control limits and CL (columns M, N and O). Please make your chart big enough to be read easily and label the axes. 4) A row below your R-chart, type in your answer to the following question: Has the range of ambulance response time been in-control over the past 2 weeks? - because Page 1 of 1 563 words English (United States) O Focus E + 90%


