

Question: please answer and explain This question will help you to interpret correctly and differentiate between p value for an assumption test as opposed to p
please answer and explain
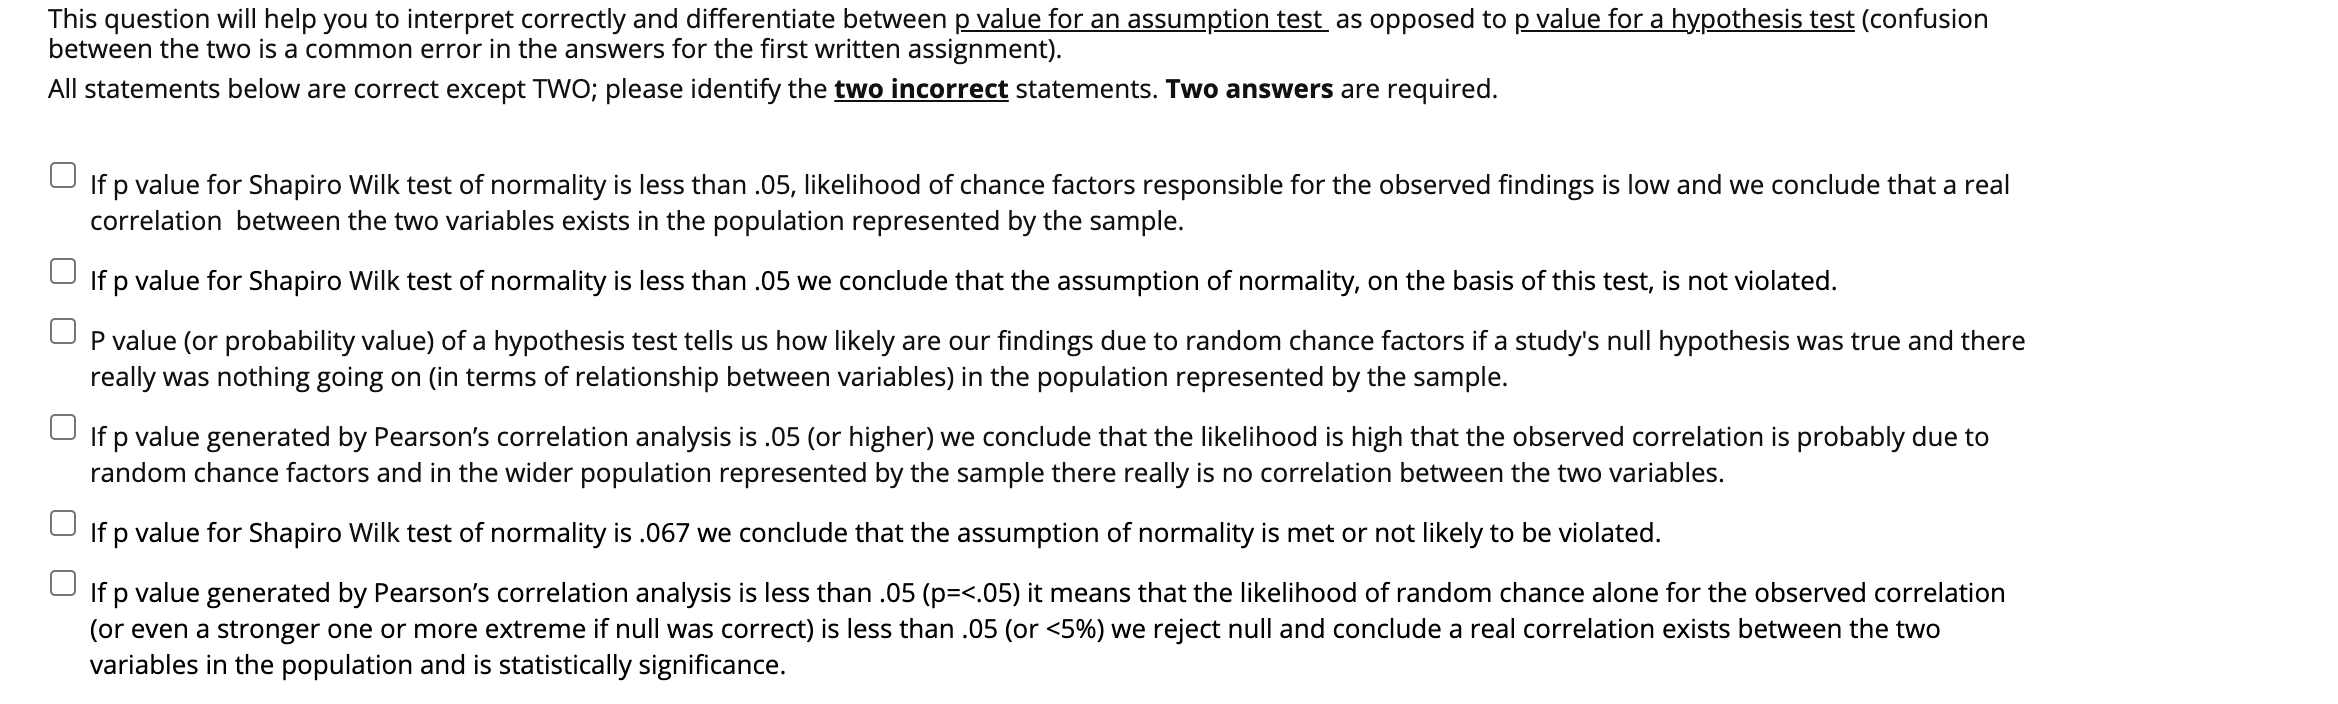
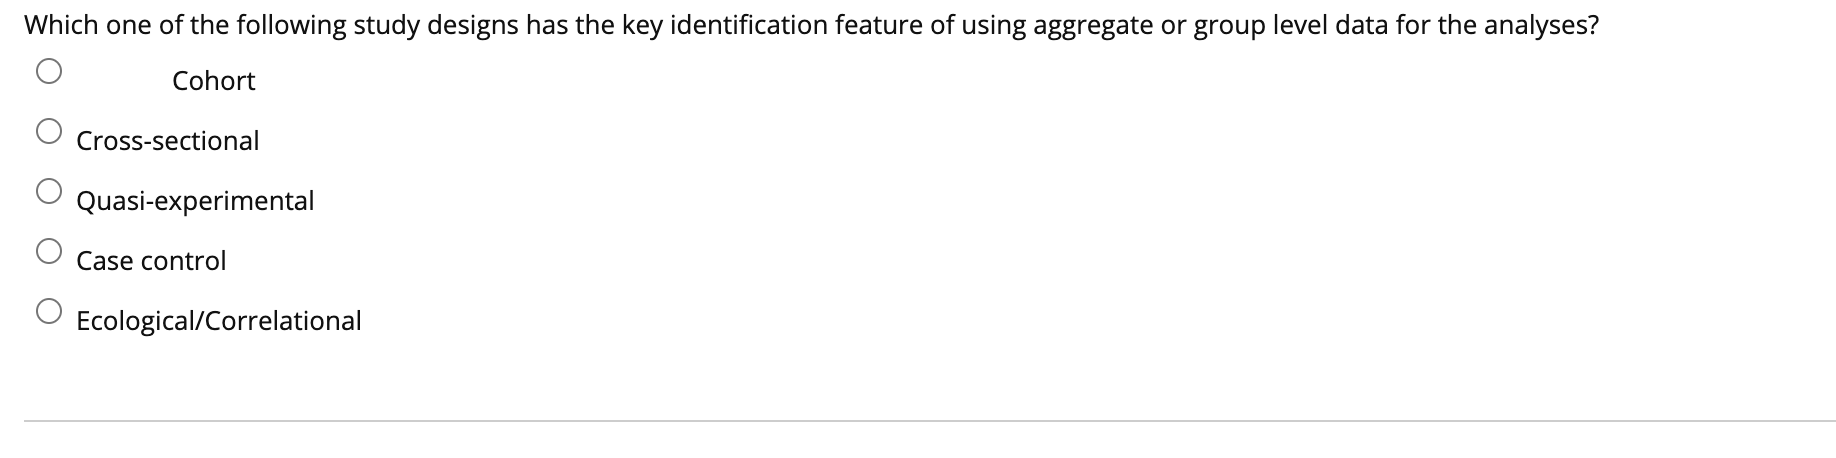
This question will help you to interpret correctly and differentiate between p value for an assumption test as opposed to p value for a hypothesis test (confusion between the two is a common error in the answers for the rst written assignment). All statements below are correct except TWO; please identify the two incorrect statements. TWo answers are required. If p value for Shapiro Wilk test of normality is less than .05, likelihood of chance factors responsible for the observed ndings is low and we conclude that a real correlation between the two variables exists in the population represented by the sample. If p value for Shapiro Wilk test of normality is less than .05 we conclude that the assumption of normality, on the basis of this test. is not violated. P value (or probability value) of a hypothesis test tells us how likely are our ndings due to random chance factors if a study's null hypothesis was true and there really was nothing going on (in terms of relationship between variables) in the population represented by the sample. If p value generated by Pearson's correlation analysis is .05 (or higher) we conclude that the likelihood is high that the obsen/ed correlation is probably due to random chance factors and in the wider population represented by the sample there really is no correlation between the two variables. If p value for Shapiro Wilk test of normality is .067 we conclude that the assumption of normality is met or not likely to be violated. l I If p value generated by Pearson's correlation analysis is less than .05 (p=<.05 it means that the likelihood of random chance alone for observed correlation even a stronger one or more extreme if null was correct is less than .05 we reject and conclude real exists between two variables in population statistically signicance. which following study designs has key identication feature using aggregate group level data analyses cohort o crosssectional quasi-experimental case control ecological>
Step by Step Solution
There are 3 Steps involved in it

Get step-by-step solutions from verified subject matter experts