

Question: please answer as fast as possible! thank you so much.(: 7. Create your own graph of the data in Table 2 Your graph should include
please answer as fast as possible!
thank you so much.(: 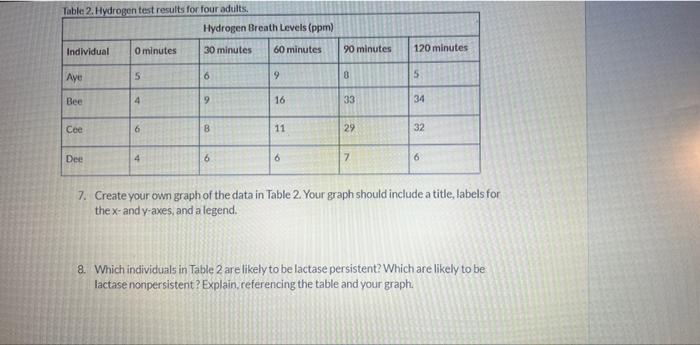
7. Create your own graph of the data in Table 2 Your graph should include a title, labels for the x - and y-axes, and a legend. 8. Which individuals in Table 2 are likely to be lactase persistent? Which are likely to be lactase nonpersistent? Explain, referencing the table and your graph. 7. Create your own graph of the data in Table 2 Your graph should include a title, labels for the x - and y-axes, and a legend. 8. Which individuals in Table 2 are likely to be lactase persistent? Which are likely to be lactase nonpersistent? Explain, referencing the table and your graph
Step by Step Solution
There are 3 Steps involved in it
1 Expert Approved Answer
Step: 1 Unlock

Question Has Been Solved by an Expert!
Get step-by-step solutions from verified subject matter experts
Step: 2 Unlock
Step: 3 Unlock