

Question: please answer asap Given the text file temperature.txt containing temperatures for various Canadian cities, develop a Raptor flowchart to find and display the cities whose
please answer asap 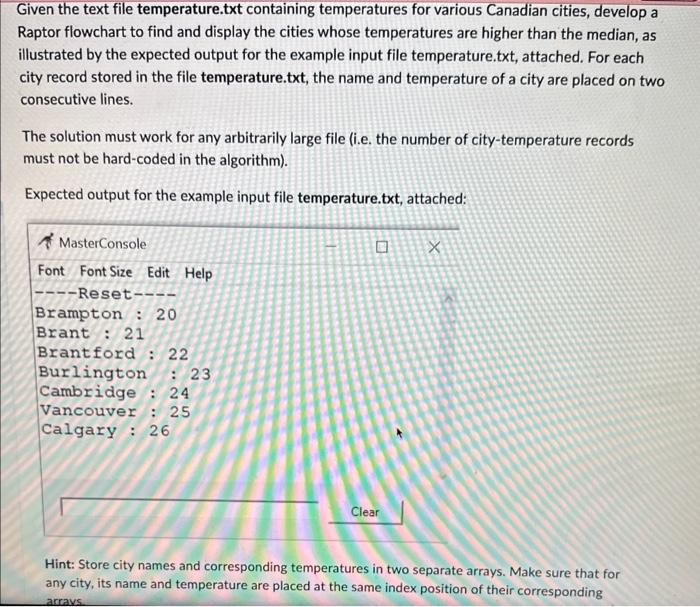
Given the text file temperature.txt containing temperatures for various Canadian cities, develop a Raptor flowchart to find and display the cities whose temperatures are higher than the median, as illustrated by the expected output for the example input file temperature.txt, attached. For each city record stored in the file temperature.txt, the name and temperature of a city are placed on two consecutive lines. The solution must work for any arbitrarily large file (i.e, the number of city-temperature records must not be hard-coded in the algorithm). Expected output for the example input file temperature.txt, attached: Hint: Store city names and corresponding temperatures in two separate arrays. Make sure that for any city, its name and temperature are placed at the same index position of their corresponding Step by Step Solution
There are 3 Steps involved in it
1 Expert Approved Answer
Step: 1 Unlock

Question Has Been Solved by an Expert!
Get step-by-step solutions from verified subject matter experts
Step: 2 Unlock
Step: 3 Unlock