

Question: Please answer B and C CHAPTER 4 EXERCISES 1. (Dataset: NES. Variables: Who_2016, better_worse past_econ, nesw.) What factors determine how people A Test this hypothesis:
Please answer B and C
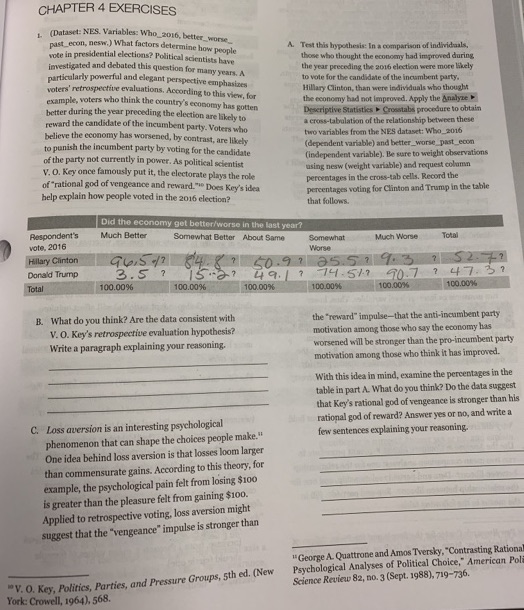
CHAPTER 4 EXERCISES 1. (Dataset: NES. Variables: Who_2016, better_worse past_econ, nesw.) What factors determine how people A Test this hypothesis: In a comparison of individuals, vote in presidential elections? Political scientists have those who thought the economy had improved during investigated and debated this question for many years. A the year preceding the 2016 election were more likely particularly powerful and elegant perspective emphasizes to vote for the candidate of the incumbent party. voters' retrospective evaluations, According to this view, for Hillary Clinton, than were individuals who thought example, voters who think the country's economy has gotten the economy had not improved. Apply the Analyze better during the year preceding the election are likely to Descriptive Statistics . Crosstabs procedure to obtain reward the candidate of the incumbent party. Voters who a cross-tabulation of the relationship between these believe the economy has worsened, by contrast, are likely two variables from the NES dataset: Who_2016 to punish the incumbent party by voting for the candidate (dependent variable) and better_worse_past_econ of the party not currently in power. As political scientist (independent variable). Be sure to weight observations V. O. Key once famously put it, the electorate plays the role using nesw (weight variable) and request column of "rational god of vengeance and reward.""Does Key's idea percentages in the cross-tab cells. Record the help explain how people voted in the 2016 election? percentages voting for Clinton and Trump in the table that follows. Did the economy get better/worse in the last year? Respondent's Much Better Somewhat Better About Same Somewhat Much Worse Total vote, 2016 Worse Hillary Clinton 64. 8 9 40 . 91 25.5 1 9.3 52.7 7 Donald Trump 3.5 7 15+27 49.1 7 74 517 907 7 47. 37 Total 100.00% 100.00% 100.00% 100.009% 100.00%% 100.00% B. What do you think? Are the data consistent with the "reward"impulse-that the anti-incumbent party V. O. Key's retrospective evaluation hypothesis? motivation among those who say the economy has Write a paragraph explaining your reasoning. worsened will be stronger than the pro-incumbent party motivation among those who think it has improved. With this idea in mind, examine the percentages in the table in part A. What do you think? Do the data suggest that Key's rational god of vengeance is stronger than his rational god of reward? Answer yes or no, and write a C. Loss aversion is an interesting psychological few sentences explaining your reasoning. phenomenon that can shape the choices people make." One idea behind loss aversion is that losses loom larger than commensurate gains. According to this theory, for example, the psychological pain felt from losing $100 is greater than the pleasure felt from gaining $100. Applied to retrospective voting, loss aversion might suggest that the "vengeance" impulse is stronger than "George A Quattrone and Amos Tversky, "Contrasting Rationa Psychological Analyses of Political Choice," American Pol "V. O. Key, Politics, Parties, and Pressure Groups, 5th ed. (New Science Review 82, no. 3 (Sept. 1988), 719-736. York: Crowell, 1964), 568
Step by Step Solution
There are 3 Steps involved in it

Get step-by-step solutions from verified subject matter experts